. 2025 Jun 16;26(12):5756.
doi: 10.3390/ijms26125756.

Genome-Wide Identification, Plasma Membrane Localization, and Functional Validation of the SUT Gene Family in Yam (Dioscorea cayennensis subsp. rotundata)

Affiliations

Genome-Wide Identification, Plasma Membrane Localization, and Functional Validation of the SUT Gene Family in Yam (Dioscorea cayennensis subsp. rotundata)

Na Li et al. Int J Mol Sci. .

Abstract

Yam (Dioscorea cayennensis subsp. rotundata,hereafter referred to as Dioscorea rotundata) is a staple tropical tuber crop with notable nutritional and economic value. Its development and yield depend on efficient sucrose allocation from source tissues. Sucrose transporters (SUTs), a conserved family of membrane proteins, mediate sucrose loading, translocation, and unloading. Although well-studied in model plants and cereals, SUTs in yam remain largely uncharacterized. This study aims to identify and characterize the SUT gene family in yam and explore their roles in sucrose transport and tuber development. We conducted a genome-wide analysis of yam SUT genes, including gene structure, subcellular localization, and phylogeny. Molecular docking was used to predict sucrose-binding residues, and qRT-PCR assessed gene expression across tissues and tuber developmental stages. Eight SUT genes were identified and classified based on sequence similarity and domain structure. Docking analysis revealed key residues involved in sucrose binding and possible conformational shifts influencing transport. Expression profiling showed that most SUT genes, especially in the tuber apex, were progressively upregulated during development, suggesting roles in sucrose unloading and cell expansion. Additionally, functional validation of DrSUT1 in Arabidopsis thaliana confirmed its involvement in sucrose transport, supporting its role in yam sucrose partitioning. Yam SUT genes, especially those highly expressed in sink tissues, are involved in sucrose partitioning and tuber development. These findings provide structural and functional insights into SUT-mediated sugar transport and lay a foundation for improving sucrose utilization and yield in yam and other tuber crops.

Keywords: Dioscorea rotundata; gene expression; molecular docking simulations; sucrose transporter (SUT).


Conflict of interest statement

The authors declare that they have no known competing financial interests or personal relationships that could have appeared to influence the work reported in this paper.

Figures

Figure 1
Figure 1
Predicted 3D Binding Models of Sucrose with the SUT Protein via Maestro, DOCK, and AutoDock Vina. (A) 3D binding model of the SUT protein (blue) with the compound sucrose (yellow) predicted by Maestro. Key residues are shown as sticks, and hydrogen bonds are represented by yellow dashed lines. Binding energy: −7.868 kcal/mol. (B) 3D binding model of the SUT protein (blue) with the compound sucrose (cyan) predicted by DOCK. Key residues are shown as sticks, and hydrogen bonds are represented by yellow dashed lines. Binding energy: −6.158 kcal/mol. (C) 3D binding model of the SUT protein (blue) with the compound sucrose (green) predicted by AutoDock Vina. Key residues are shown as sticks, and hydrogen bonds are represented by yellow dashed lines. Binding energy: −6.411 kcal/mol.
Figure 2
Figure 2
Phylogenetic tree of sucrose transporter (SUT) proteins from Dioscorea rotundata and Arabidopsis thaliana. The tree was constructed to illustrate evolutionary relationships among the SUT family members. Proteins from Dioscorea rotundata are marked with yellow dots, and those from A. thaliana are marked with red dots. The tree is divided into three major clades: Clade I (blue), Clade II (green), and Clade III (purple). Colored sectors indicate clade classification. Bootstrap values are shown as purple circles on the branches.
Figure 3
Figure 3
Chromosomal locations and collinearity of SUT genes. SUT chromosome mapping, where the scale on the left was used to estimate the length of chromosomes and the SUT genes of Dioscorea rotundata were distributed on four chromosomes.
Figure 4
Figure 4
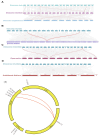
Collinearity analysis map of Dioscorea rotundata with Dioscorea alata, Dioscorea zingiberensis (A), sweet potato (B), rice (C), and Arabidopsis (D). The red lines indicate collinear gene pairs between the species. The map highlights the genomic similarities between Dioscorea rotundata and other species in the Dioscorea genus, as well as comparisons with the sweet potato (Ipomoea batatas), a member of the Convolvulaceae family, rice (Oryza sativa), a monocot, and Arabidopsis thaliana, a dicot. Gray lines in the background indicate the collinear blocks within Dioscorea rotundata and its progenitor species, while red lines represent the syntenic SUT gene pairs. (E) Collinearity analysis of SUT genes in Dioscorea rotundata.
Figure 5
Figure 5
Phylogenetic relationships, conserved motifs, protein domains, and gene structures of DrSUT gene family members. (A) Phylogenetic tree of the DrSUT protein family constructed based on full-length protein sequences using the method. The DrSUT proteins are grouped into clades within the GPH_sucrose superfamily. Branch lengths represent evolutionary distance. (B) Distribution of conserved motifs in DrSUT proteins as identified by MEME. Each colored box represents a distinct conserved motif (Motif 1 to Motif 6). Motif positions are mapped according to amino acid sequence length. (C) Conserved domain organization of DrSUT proteins. Domains are represented as color-coded boxes aligned to protein length. Annotations follow the Pfam or InterPro classification. (D) Gene structures of DrSUT family members, with exons shown as yellow boxes, introns as black lines, and untranslated regions (UTRs) as blue boxes. All genes are displayed from 5′ to 3′ direction and scaled to nucleotide length (see horizontal scale bar).
Figure 6
Figure 6
The cis-regulatory elements involved in phytohormone, development, and stress responses in the upstream regions of DrSUT gene promoters. (A) Analysis of the positional distribution of cis-regulatory elements. (B) Statistical analysis of cis-regulatory elements. ARE, involved in anaerobic induction; LTR, low temperature-responsive element; MBS, TC-rich repeats, involved in defense and stress response; G-box, GT1-motif, light-responsive elements; CAT box, GC-motif involved in meristem expression and anoxic specific inducibility, respectively.
Figure 7
Figure 7
Gene ontology (GO) annotation of the DrSUTs and DrSWEETs, showing enrichment in the Cellular component, Molecular function, and Biological process categories.
Figure 8
Figure 8
(A) Expression profiles of DrSUT gene family members in different tissues of Dioscorea rotundata. A radial heatmap shows the relative expression levels of DrSUT1 to DrSUT8 across five tissue types: tuber (head), tuber (middle), young stem, leaf, and xylem. Color gradients represent log2-transformed expression values, with orange indicating high expression and green indicating low expression. (B) The relative expression levels of DrSUT genes in different developmental phases. Different lowercase letters on the bar indicate significant differences among treatments (p < 0.05). (C) Bubble-heatmap showing Pearson correlation coefficients (r) between DrSUT family gene expression (rows) and sugar contents (columns: sucrose, glucose, fructose) measured in yam tubers at key developmental stages. Bubble color indicates correlation direction (red = positive; blue = negative), bubble size corresponds to absolute correlation magnitude, and bubble border denotes statistical significance (solid border = p < 0.05).
Figure 8
Figure 8
(A) Expression profiles of DrSUT gene family members in different tissues of Dioscorea rotundata. A radial heatmap shows the relative expression levels of DrSUT1 to DrSUT8 across five tissue types: tuber (head), tuber (middle), young stem, leaf, and xylem. Color gradients represent log2-transformed expression values, with orange indicating high expression and green indicating low expression. (B) The relative expression levels of DrSUT genes in different developmental phases. Different lowercase letters on the bar indicate significant differences among treatments (p < 0.05). (C) Bubble-heatmap showing Pearson correlation coefficients (r) between DrSUT family gene expression (rows) and sugar contents (columns: sucrose, glucose, fructose) measured in yam tubers at key developmental stages. Bubble color indicates correlation direction (red = positive; blue = negative), bubble size corresponds to absolute correlation magnitude, and bubble border denotes statistical significance (solid border = p < 0.05).
Figure 9
Figure 9
Subcellular localization of two representative SUT proteins. GFP is indicated as empty in the figure, and a membrane localization protein (pCAMBIA1300-35S-PM-mCherry) tagged using co-transformed mCherry was used to visualize the plasma membranes. The fields included the green fluorescence field (488 nm), nucleus autofluorescence field (570 nm), bright field, and merged field. Scale bar is 20 μm.
Figure 10
Figure 10
Functional characterization of DrSUT1 as a sucrose transporter. (A) Time-course of sucrose uptake in yeast cells expressing DrSUT1 (pDR196-DrSUT1) versus empty vector (EV). (B) Kinetic analysis of DrSUT1-mediated sucrose uptake, including nonlinear regression curve and derived parameters (Km and Vmax). (C) Lineweaver–Burk plot derived from uptake data in (B), confirming linearity and kinetic values. (D) Primary root lengths of wild-type (WT), OE1, and OE2 Arabidopsis seedlings grown on MS medium for 7 days. (E) qPCR analysis of DrSUT1 transcript levels in WT, OE1, and OE2. (F) Sucrose content in leaves of WT and DrSUT1-overexpressing lines. Data are presented as mean ± SD (n = 3). Asterisks indicate significant differences from WT (* p < 0.05, ** p < 0.01, **** p < 0.0001; one-way ANOVA followed by Tukey’s test).

Similar articles

References

    1. Wang Z., Wei X., Yang J., Li H., Ma B., Zhang K., Zhang Y., Cheng L., Ma F., Li M. Heterologous expression of the apple hexose transporter MdHT2.2 altered sugar concentration with increasing cell wall invertase activity in tomato fruit. Plant Biotechnol. J. 2020;18:540–552. doi: 10.1111/pbi.13222. - DOI - PMC - PubMed
    1. Li J., Hu Y., Hu J., Xie Q., Chen X., Qi X. Sucrose synthase: An enzyme with multiple roles in plant physiology. J. Plant Physiol. 2024;303:154352. doi: 10.1016/j.jplph.2024.154352. - DOI - PubMed
    1. Li W., Sun K., Ren Z., Song C., Pei X., Liu Y., Wang Z., He K., Zhang F., Zhou X., et al. Molecular Evolution and Stress and Phytohormone Responsiveness of SUT Genes in Gossypium hirsutum. Front. Genet. 2018;9:494. doi: 10.3389/fgene.2018.00494. - DOI - PMC - PubMed
    1. Cater R.J., Chua G.L., Erramilli S.K., Keener J.E., Choy B.C., Tokarz P., Chin C.F., Quek D.Q.Y., Kloss B., Pepe J.G., et al. Structural basis of omega-3 fatty acid transport across the blood–brain barrier. Nature. 2021;595:315–319. doi: 10.1038/s41586-021-03650-9. - DOI - PMC - PubMed
    1. Leach K.A., Tran T.M., Slewinski T.L., Meeley R.B., Braun D.M. Sucrose transporter2 contributes to maize growth, development, and crop yield. J. Integr. Plant Biol. 2017;59:390–408. doi: 10.1111/jipb.12527. - DOI - PubMed

MeSH terms

Grants and funding

LinkOut - more resources