. 2025 Jun 17;26(12):5804.
doi: 10.3390/ijms26125804.

Candidate Key Proteins of Tinnitus in the Auditory and Motor Systems of the Thalamus

Affiliations

Candidate Key Proteins of Tinnitus in the Auditory and Motor Systems of the Thalamus

Johann Gross et al. Int J Mol Sci. .

Abstract

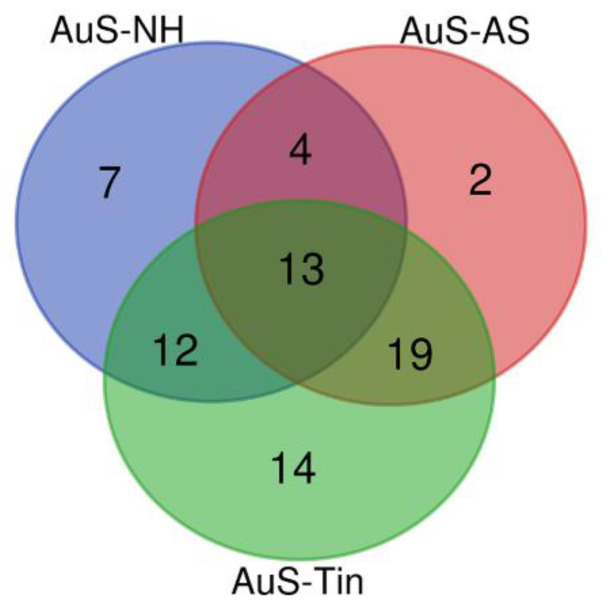
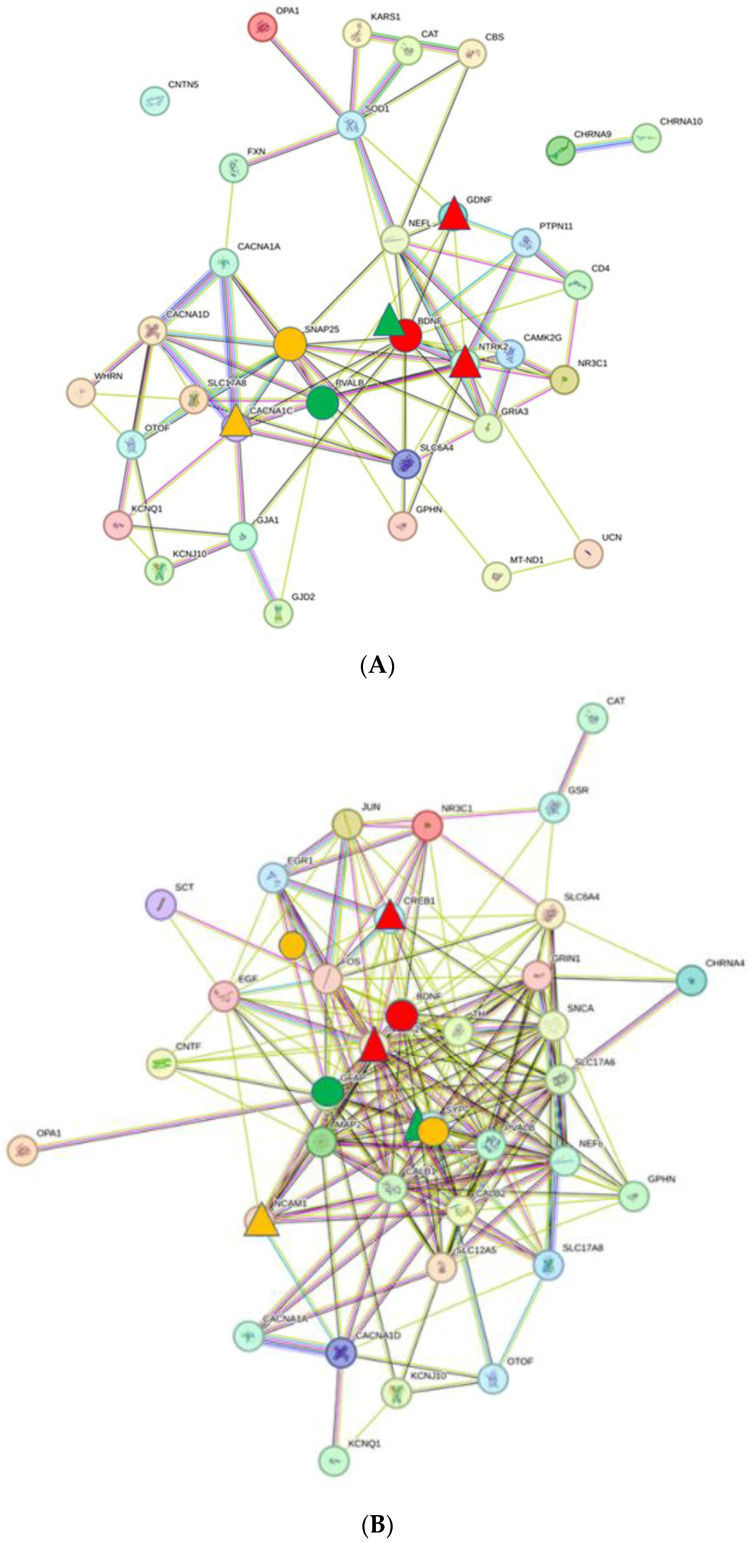
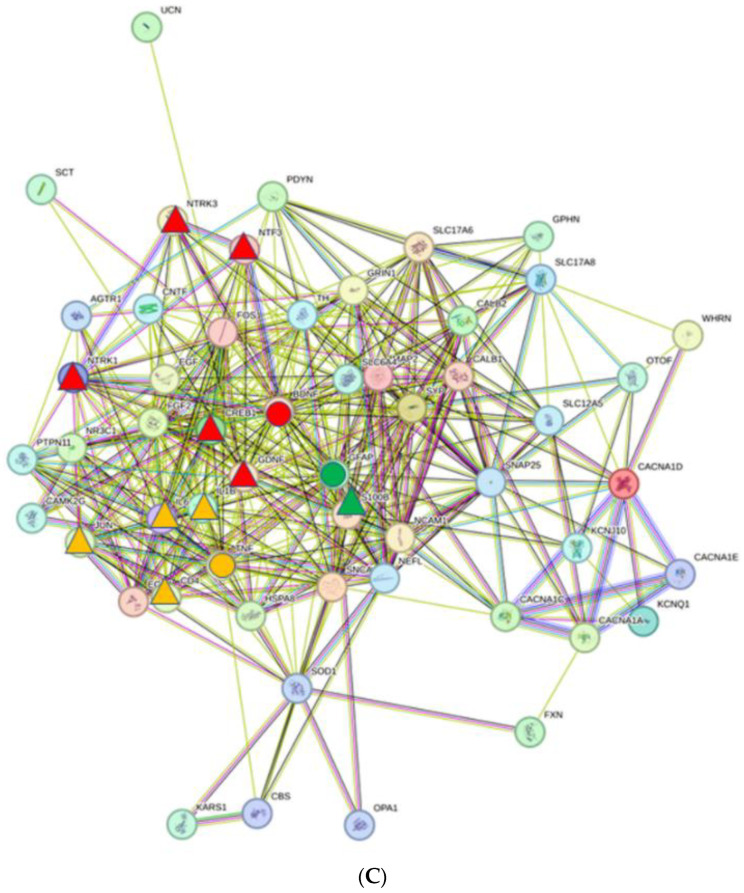
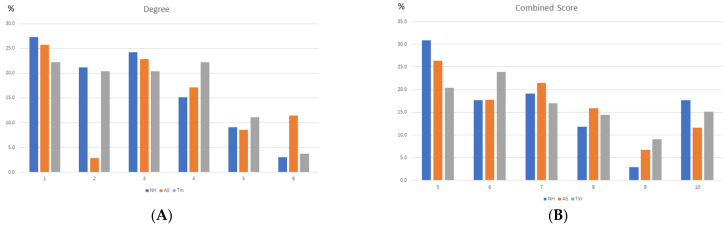
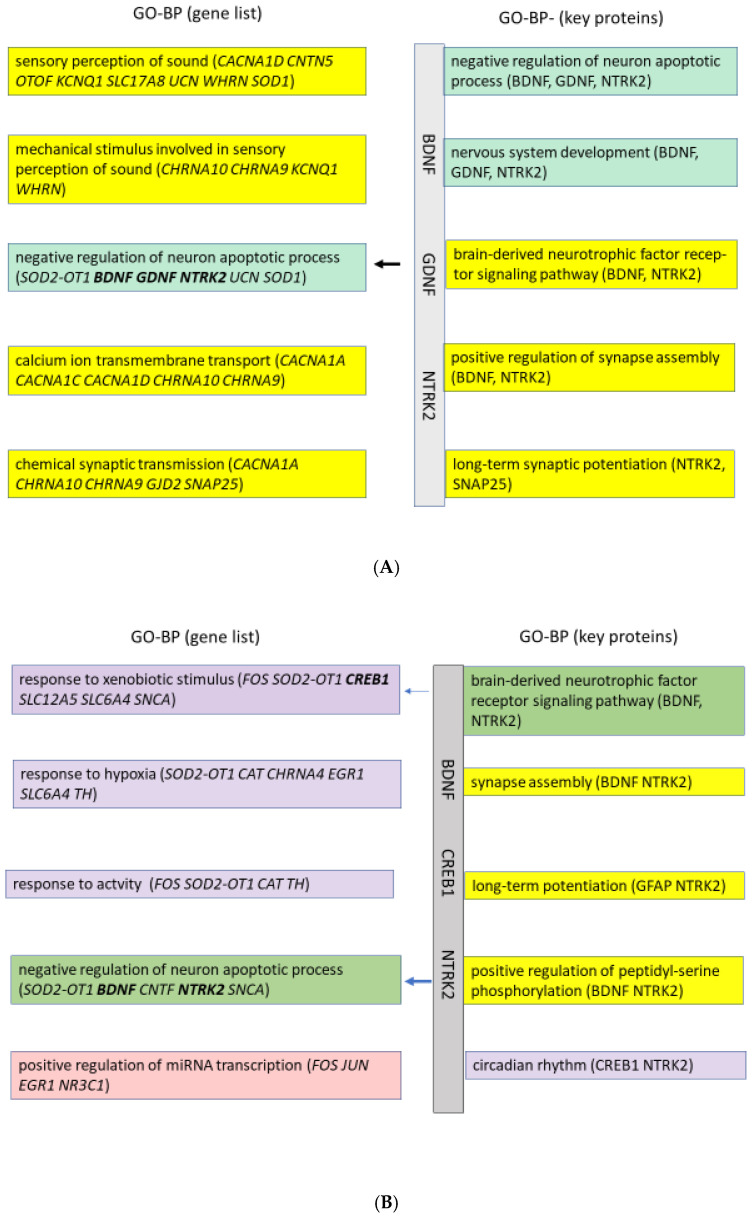
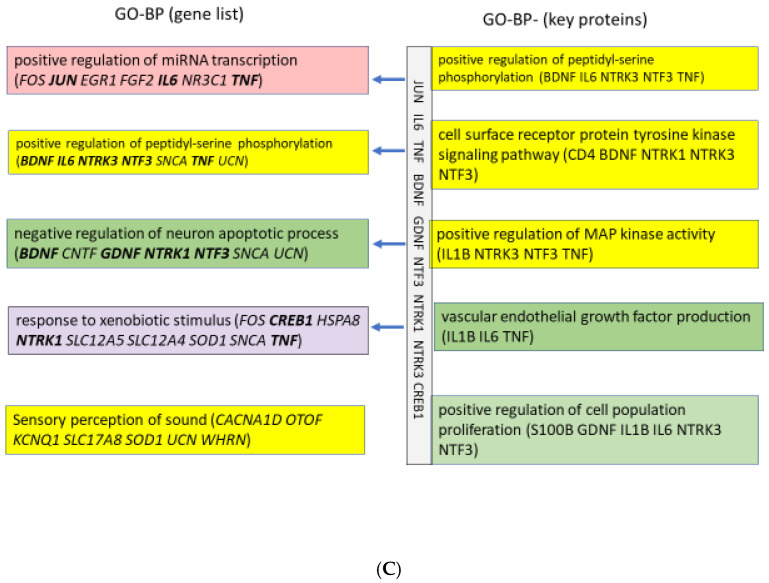
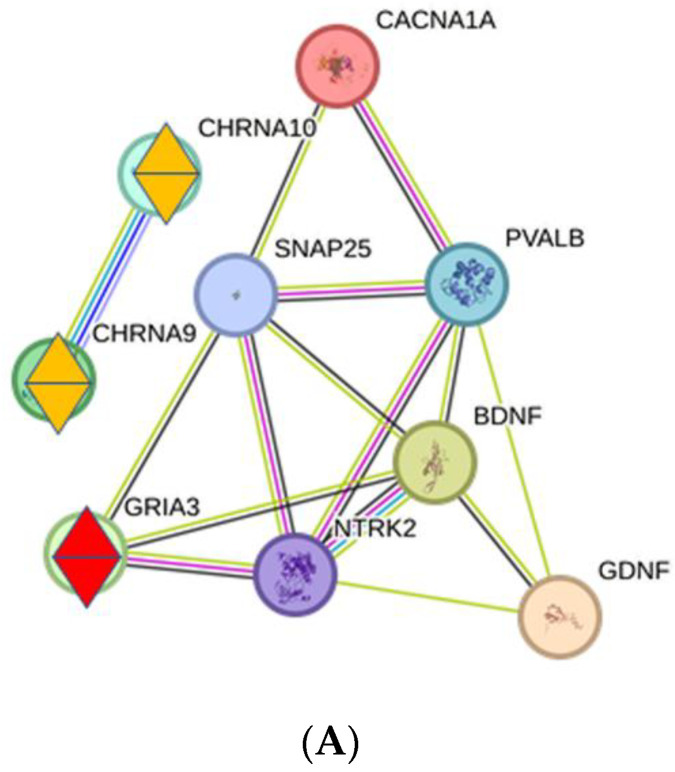
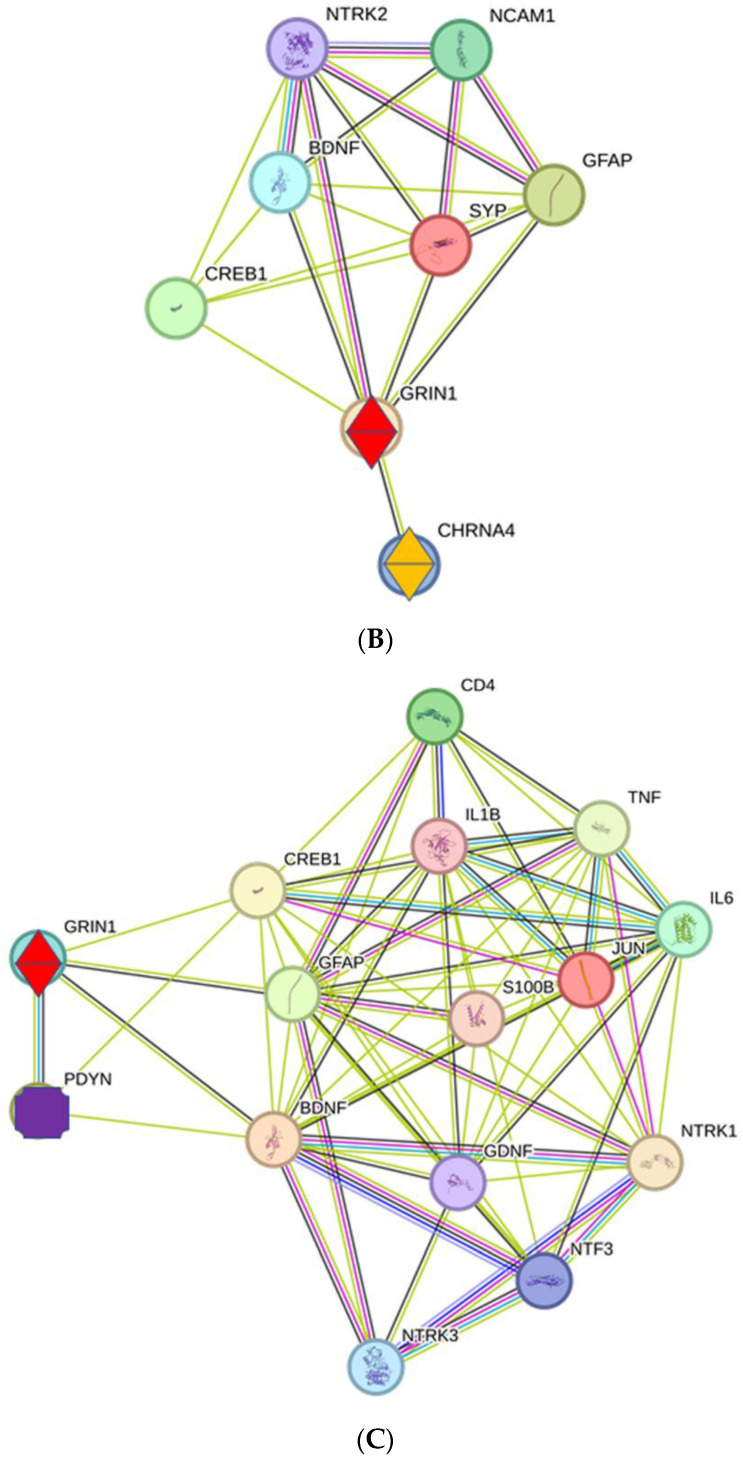
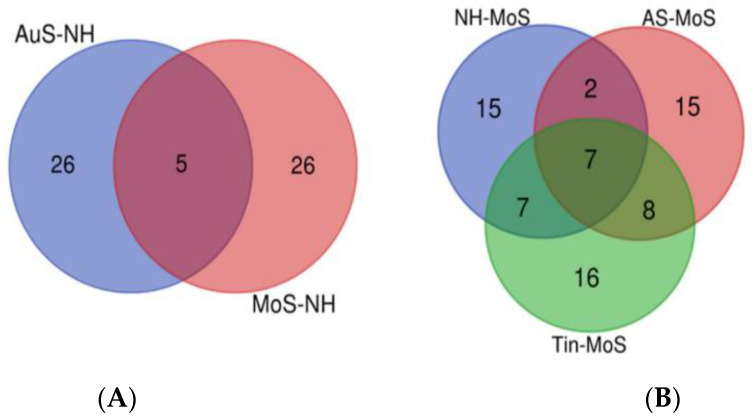
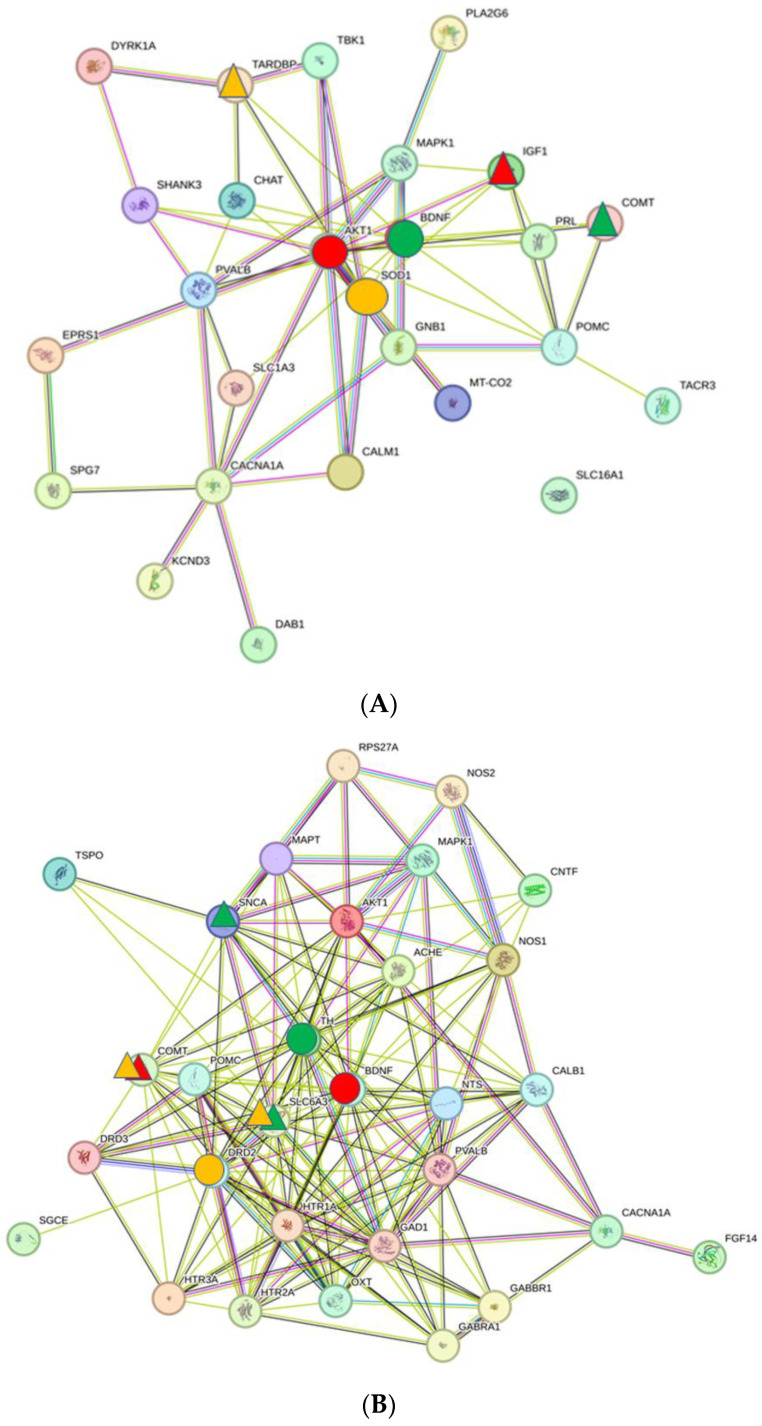
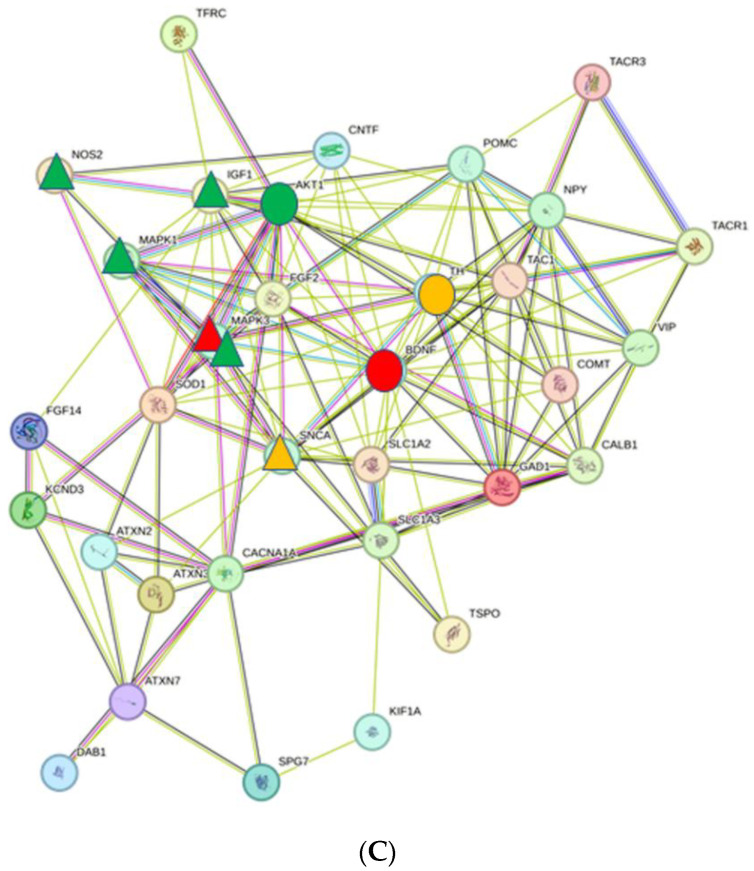
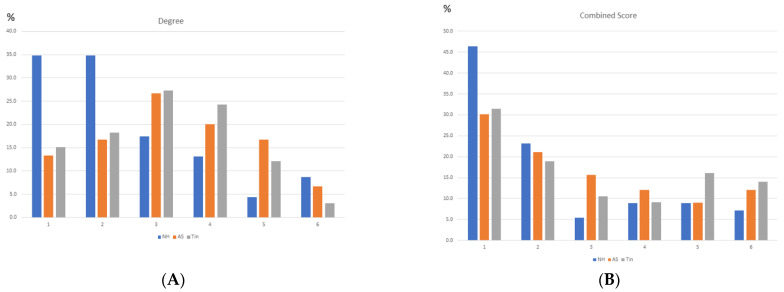
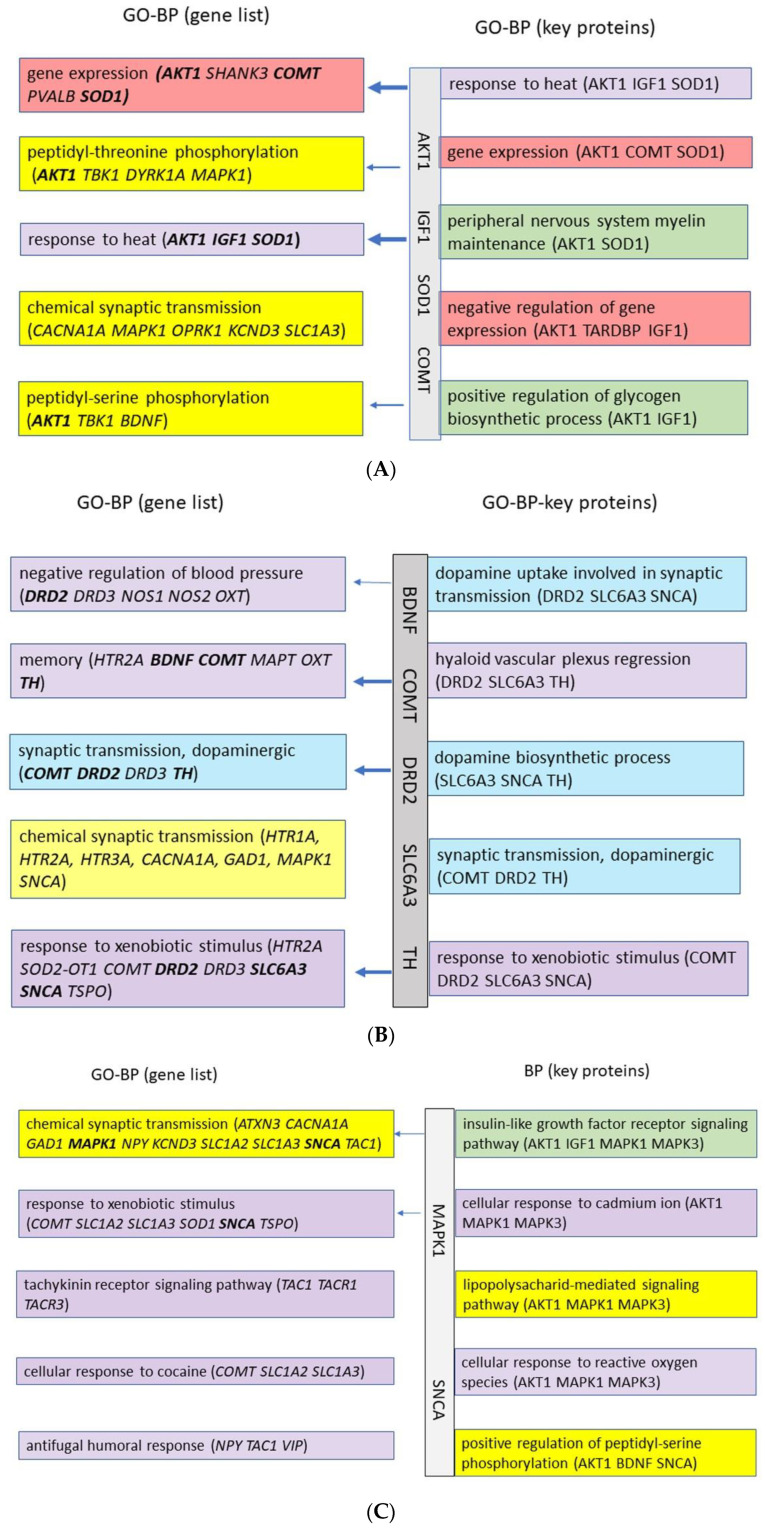
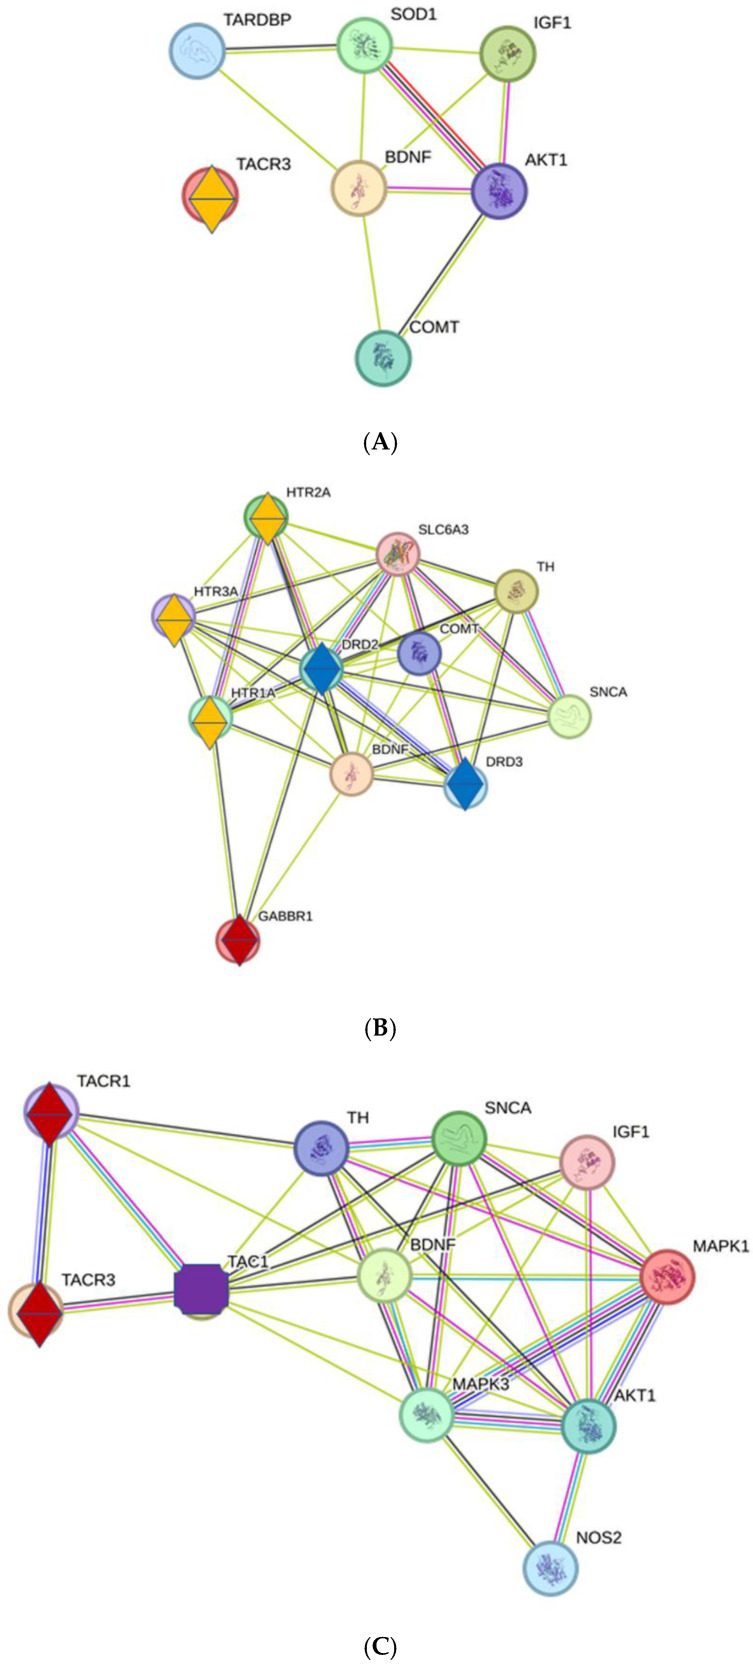
To determine candidate key proteins involved in synaptic transmission in the thalamus in tinnitus, we used bioinformatic methods by analyzing protein-protein interaction networks under different conditions of acoustic activity. The motor system was used to analyze the specificity of the response reaction in the auditory system. The databases GeneCard, STRING-, DAVID-, and Cytoscape version 3.9.1 were applied to identify the top three high-degree proteins, their high-score interaction proteins and the gene ontology-biological processes (GO-BPs) associated in the thalamus with synaptic transmission in tinnitus. Under normal hearing conditions, a balanced state of functional connectivity was observed for both systems, the auditory system and the motor system of the thalamus. Under conditions of acoustic stimulation, the GO-BP-enrichment analyses suggest that in the auditory system, tinnitus-related proteins may be involved in responses typically associated with "xenobiotic stimuli"; in the motor system, the activation of the dopaminergic system was observed. Under conditions of tinnitus in the auditory system, key proteins and the GO-BPs indicate the regulation of different developmental processes and regulation by microRNA transcription; in the motor system, tinnitus is also identified as "xenobiotic" but responded with GO-BPs, corresponding to various signaling systems, e.g., tachykinin. Key proteins and their interactions with neurotransmitter receptors may be useful indicators for tinnitus-associated changes in synaptic transmission in the thalamic auditory system.

Keywords: auditory perception; biomarker; synaptic transmission; thalamus; tinnitus.


Conflict of interest statement

The authors declare no conflicts of interest.

Figures

Figure 1
Figure 1
The Venn diagram of the genes involved in normal hearing (NH, n = 36), acoustic stimulation (AS, n = 38), and tinnitus (Tin, n = 58). The overall number of unique elements n = 71.
Figure 2
Figure 2
PPI networks of the normal hearing (NH, (A)), the acoustic stimulation (AS, (B)), and the tinnitus (Tin, (C)) processes in the auditory system of the thalamus. Topological criteria—see text. The key proteins in the networks are labeled: Red circle—top 1 high-degree protein (HDP); red triangles—high-score interaction proteins (HSIPs). Green circle—top two HDPs; green triangles—corresponding HSIPs. Yellow circle—top 3 HDP; yellow triangles—corresponding HSIPs.
Figure 2
Figure 2
PPI networks of the normal hearing (NH, (A)), the acoustic stimulation (AS, (B)), and the tinnitus (Tin, (C)) processes in the auditory system of the thalamus. Topological criteria—see text. The key proteins in the networks are labeled: Red circle—top 1 high-degree protein (HDP); red triangles—high-score interaction proteins (HSIPs). Green circle—top two HDPs; green triangles—corresponding HSIPs. Yellow circle—top 3 HDP; yellow triangles—corresponding HSIPs.
Figure 3
Figure 3
The frequency distribution of the degree (A) and CS values (B) of the NH, AS, and Tin networks. The frequency distribution of the degree and CS values were calculated as percentages of the number of nodes and edges. Group 6 of the degree distribution corresponds to the top 16.7% of the degree values. The CS values cover a range of 400–999. Group 6 of the CS distribution corresponds to CS values between 901 and 999, group 5 corresponds to CS values of 801–900, etc.
Figure 4
Figure 4
(A): Biological processes (GO) of the normal hearing process in the auditory system of the thalamus. The order is according to statistical significance. Colors were selected according to general functions: yellow—signal systems; green—developmental processes (including growth, apoptosis). Characteristic values of the GO terms: The gene list (36 IDs, 125 chart records, p < 0.01): the percentage of the proteins involved in the GO term 11–22; p-values 1.2E-8 to 6.8E-4; fold enrichment 12–117. The key protein list (6 IDs, 22 chart records, p < 0.05): the percentage of the proteins involved in the GO term 33–50; p-values 6.2E-4 to 1.7E-2; fold enrichment 22–120. The Benjamini–Hochberg value for GO-BP terms (key proteins) = 4.9E-1 to 8.3E-2. (B): Biological processes (GO) of the acoustic stimulation process in the auditory system of the thalamus. The order is according to statistical significance. Colors: violet—response to xenobiotic signals; green—developmental process (apoptosis); red—miRNA transcription; yellow—signal systems. The gene list (38 IDs, 95 chart records, p < 0.01): the percentage of the proteins involved in the GO term 11–18; p-values 6.0E-6 to 1.9E-4; fold enrichment 15–41. The key protein list (6 IDs, 17 chart records, p < 0.05): the percentage of the proteins involved in the GO term 33.3; p-values 1.4E-2 to 1.8E-2; fold enrichment 92–104. The Benjamini–Hochberg value for GO-BP terms (key proteins) = 6.0E-1. (C): Biological processes (GO) of the tinnitus process in the auditory system of the thalamus. Red—miRNA transcription; yellow—signal systems; green—developmental processes (negative regulation of apoptosis); violet—response to xenobiotic stimulus. The gene list (58 IDs, 236 chart records, p < 0.01): the percentage of the proteins involved in the GO term 12–16; p-values 1.7E-8 to 5.7E-6; fold enrichment 13–41. The key protein list (10 IDs, 111 chart records, p < 0.05): the percentage of the proteins involved in the GO term 25–50; p-values 4.8E-7 to 1.7E-5; fold enrichment 22–347. The Benjamini–Hochberg value for GO-BP terms (key proteins) = 2.3E-4 to 4.9E-4. The arrows indicate GO terms that include key proteins.
Figure 4
Figure 4
(A): Biological processes (GO) of the normal hearing process in the auditory system of the thalamus. The order is according to statistical significance. Colors were selected according to general functions: yellow—signal systems; green—developmental processes (including growth, apoptosis). Characteristic values of the GO terms: The gene list (36 IDs, 125 chart records, p < 0.01): the percentage of the proteins involved in the GO term 11–22; p-values 1.2E-8 to 6.8E-4; fold enrichment 12–117. The key protein list (6 IDs, 22 chart records, p < 0.05): the percentage of the proteins involved in the GO term 33–50; p-values 6.2E-4 to 1.7E-2; fold enrichment 22–120. The Benjamini–Hochberg value for GO-BP terms (key proteins) = 4.9E-1 to 8.3E-2. (B): Biological processes (GO) of the acoustic stimulation process in the auditory system of the thalamus. The order is according to statistical significance. Colors: violet—response to xenobiotic signals; green—developmental process (apoptosis); red—miRNA transcription; yellow—signal systems. The gene list (38 IDs, 95 chart records, p < 0.01): the percentage of the proteins involved in the GO term 11–18; p-values 6.0E-6 to 1.9E-4; fold enrichment 15–41. The key protein list (6 IDs, 17 chart records, p < 0.05): the percentage of the proteins involved in the GO term 33.3; p-values 1.4E-2 to 1.8E-2; fold enrichment 92–104. The Benjamini–Hochberg value for GO-BP terms (key proteins) = 6.0E-1. (C): Biological processes (GO) of the tinnitus process in the auditory system of the thalamus. Red—miRNA transcription; yellow—signal systems; green—developmental processes (negative regulation of apoptosis); violet—response to xenobiotic stimulus. The gene list (58 IDs, 236 chart records, p < 0.01): the percentage of the proteins involved in the GO term 12–16; p-values 1.7E-8 to 5.7E-6; fold enrichment 13–41. The key protein list (10 IDs, 111 chart records, p < 0.05): the percentage of the proteins involved in the GO term 25–50; p-values 4.8E-7 to 1.7E-5; fold enrichment 22–347. The Benjamini–Hochberg value for GO-BP terms (key proteins) = 2.3E-4 to 4.9E-4. The arrows indicate GO terms that include key proteins.
Figure 5
Figure 5
(A): Interactions between key proteins and neurotransmitter receptors under normal hearing conditions. Neurotransmitter receptors are marked with two triangles; red—excitatory, yellow—modulatory. (B): Interactions between key proteins and neurotransmitter receptors under conditions of acoustic stimulation. Neurotransmitter receptors are marked with two triangles; red—excitatory, yellow—modulatory. (C): Interactions between key proteins and neurotransmitter receptors in the AuS in tinnitus. Neurotransmitter receptor GRIN1 is marked with two red triangles; PDYN (purple polygon) interacts closely with GRIN1 (CS = 930), with BDNF (CS = 582) and CREB1 (CS = 571).
Figure 5
Figure 5
(A): Interactions between key proteins and neurotransmitter receptors under normal hearing conditions. Neurotransmitter receptors are marked with two triangles; red—excitatory, yellow—modulatory. (B): Interactions between key proteins and neurotransmitter receptors under conditions of acoustic stimulation. Neurotransmitter receptors are marked with two triangles; red—excitatory, yellow—modulatory. (C): Interactions between key proteins and neurotransmitter receptors in the AuS in tinnitus. Neurotransmitter receptor GRIN1 is marked with two red triangles; PDYN (purple polygon) interacts closely with GRIN1 (CS = 930), with BDNF (CS = 582) and CREB1 (CS = 571).
Figure 6
Figure 6
(A): The Venn diagram of the genes present in the auditory system (AuS) and the motor system (MoS) of the thalamus under conditions of normal hearing. The overall number of unique elements: AuS—65, MoS—70. (B): Genes involved in normal hearing (NH, n = 31), acoustic stimulation (AS, n = 32), and tinnitus (Tin, n = 38) in the MoS of the thalamus.
Figure 7
Figure 7
The PPI network of the NH (A), AS (B), and Tin (C) processes in the motor system of the thalamus. For the topological criteria, see the text. The key proteins are labeled in the networks. The key proteins in the networks are labeled: Red circle—top 1 high-degree protein (HDP); red triangles—high-score interaction proteins (HSIPs). Green circle—top 2 HDP; green triangles—corresponding HSIPs. Yellow circle—top 3 HDP; yellow triangles—corresponding HSIPs.
Figure 7
Figure 7
The PPI network of the NH (A), AS (B), and Tin (C) processes in the motor system of the thalamus. For the topological criteria, see the text. The key proteins are labeled in the networks. The key proteins in the networks are labeled: Red circle—top 1 high-degree protein (HDP); red triangles—high-score interaction proteins (HSIPs). Green circle—top 2 HDP; green triangles—corresponding HSIPs. Yellow circle—top 3 HDP; yellow triangles—corresponding HSIPs.
Figure 8
Figure 8
The frequency distribution of the degree (A) and CS (B) values of the NH, AS, and Tin networks. The frequency distribution of the degree and CS values were calculated as percentages of the number of nodes and edges. Group 6 of the degree distribution corresponds to the top 16.7% of the degree values. Group 6 of the CS distribution corresponds to CS values of 901–999, group 5 correspond to CS values of 801–900, etc.
Figure 9
Figure 9
(A): The biological processes (GO) of the normal hearing process in the motor system of the thalamus. The order is according to statistical significance. Colors selected according to general functions. Red—gene expression; yellow—signal systems; violet—uncharacteristic GO terms; green—biosynthetic processes. The gene list (25 IDs, 44 chart records, p < 0.01): the percentage of the proteins involved in the GO term 12–20; p-values 5.3E-5 to 3.4E-3; fold enrichment 13–50. The key protein list (6 IDs, 33 chart records, p < 0.05): the percentage of the proteins involved in the GO term 33–50; p-values 4.1E-5 to 4.4E-3; fold enrichment 31–719. The Benjamini–Hochberg value for GO-BP terms (key proteins) = 1.3E-2 to 2.7E-1. (B): The biological processes (GO) of the acoustic stimulation process in the motor system of the thalamus. Violet—response to signals from the auditory system; blue—response of the dopaminergic system; yellow—signal system. The gene list (30 IDs 113 chart records, p < 0.01): the percentage of the proteins involved in the GO term 13–23; p-values 9.3E-8 to 1.9E-6; fold enrichment 18–216. The key protein list (6 IDs, 57 chart records, p < 0.05): the percentage of the proteins involved in the GO term 50–67; p-values 8.0E-7 to 2.2E-5; fold enrichment 50–1618. The Benjamini–Hochberg value for GO-BP terms (key proteins) = 1.2E-3 to 1.6E-4. (C): The biological processes (GO) of the tinnitus process in the motor system of the thalamus. Yellow—signal systems; violet—response to non-specific signals; green—growth factor signaling. The gene list (33 IDs, 121 chart records, p < 0.01). The percentage of the proteins involved in the GO term 9–30; p-values 9.0E-11 to 1.7E-4; fold enrichment 14–221. The key protein list (8 IDs, 209 chart records, p < 0.05): the percentage of the proteins involved in the GO term 38–50; p-values 2.4E-6 to 2.7E-4; fold enrichment 104–208. The Benjamini–Hochberg value for GO-BP terms (key proteins) = 9.9E-4 to 1.5E-1. The arrows indicate GO terms that include key proteins.
Figure 10
Figure 10
(A): Interactions between key proteins and neurotransmitter receptors under normal hearing conditions. The receptor for TAC is marked with two triangles; yellow—modulatory. (B): Interactions between key proteins and neurotransmitter receptors under conditions of acoustic stimulation. Neurotransmitter receptors are marked with two triangles; yellow—modulatory; blue—dopaminergic; brown—GABA-ergic. (C): Interactions between key proteins and neurotransmitter receptors in tinnitus. Neurotransmitter receptors are marked with two triangles; brown—modulatory or inhibitory. TAC1 (purple polygon) mediates the effects of key proteins with TAC receptors.

Similar articles

References

    1. Baguley D., McFerran D., Hall D. Tinnitus. Lancet. 2013;382:1600–1607. doi: 10.1016/S0140-6736(13)60142-7. - DOI - PubMed
    1. Tziridis K., Friedrich J., Brüeggemann P., Mazurek B., Schulze H. 402-Estimation of Tinnitus-Related Socioeconomic Costs in Germany. Int. J. Environ. Res. Public Health. 2022;19:10455. doi: 10.3390/ijerph191610455. - DOI - PMC - PubMed
    1. Jarach C.M., Karydou K., Trochidis I., Bernal-Robledano A., van den Brandt P.A., Cima R., Cederroth C.R., Lopez-Escamez J.A., Ghislandi S., Hall D.A., et al. The Out-of-Pocket Expenses of People with Tinnitus in Europe. J. Epidemiol. 2024;34:515–525. doi: 10.2188/jea.JE20230358. - DOI - PMC - PubMed
    1. Pyott S.J., Pavlinkova G., Yamoah E.N., Fritzsch B. Harmony in the Molecular Orchestra of Hearing: Developmental Mechanisms from the Ear to the Brain. Annu. Rev. Neurosci. 2024;47:1–20. doi: 10.1146/annurev-neuro-081423-093942. - DOI - PMC - PubMed
    1. Géléoc G.S.G., Holt J.R. Sound Strategies for Hearing Restoration. Science. 2014;344:1241062. doi: 10.1126/science.1241062. - DOI - PMC - PubMed

LinkOut - more resources