. 2025 Jun 17;26(12):5813.
doi: 10.3390/ijms26125813.

miR-7-5p and Importin-7 Regulate the p53 Dynamics and Stability in Malignant and Benign Thyroid Cells

Affiliations

miR-7-5p and Importin-7 Regulate the p53 Dynamics and Stability in Malignant and Benign Thyroid Cells

Abeer Al-Abdallah et al. Int J Mol Sci. .

Abstract

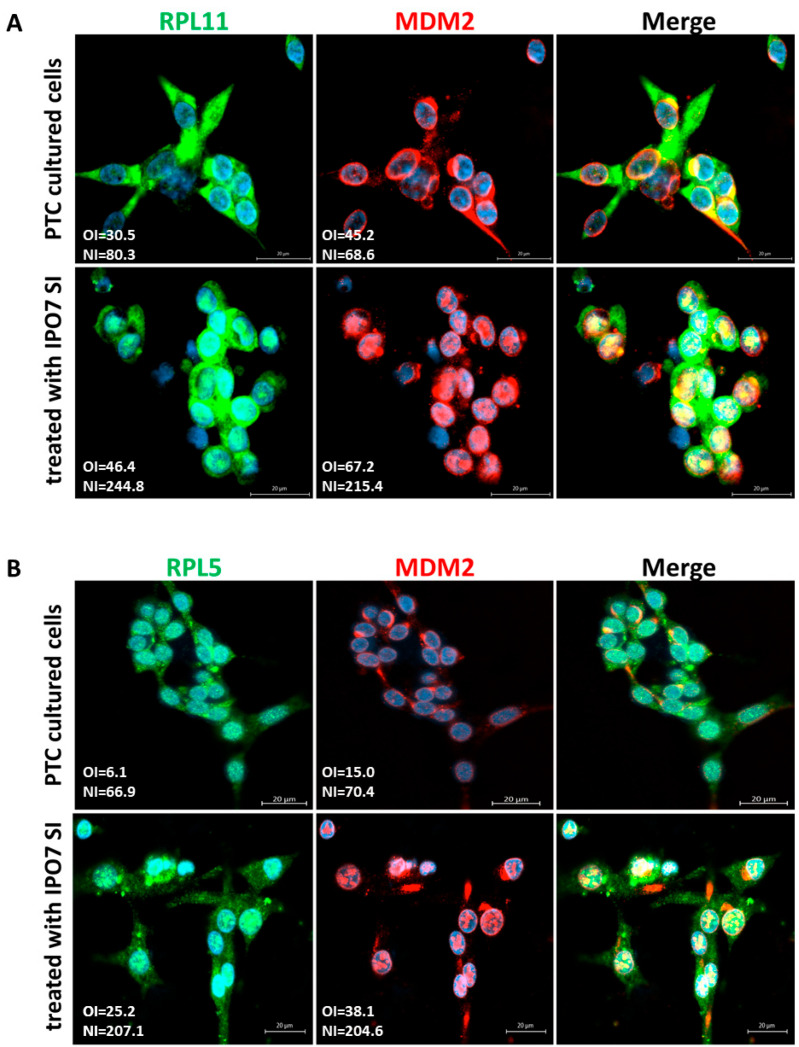
Thyroid carcinogenesis has multiple hallmarks, including evasion of tumor suppressors. Reactivation of wild-type p53 function is the ultimate goal in cancer therapy, which requires an understanding of the p53 suppression mechanism specific to the cancer type. MiR-7-5p and IPO7 are implicated in the pathogenesis of several human diseases. This work aims to investigate the role of miR-7-5p and IPO7 in p53 regulation in papillary thyroid cancer (PTC) cells. Primary cultured thyroid cells and FFPE thyroid tissues from PTC and benign cases were used. Functional experiments were performed by transfection with IPO7 siRNA or miR-7-5p mimic/inhibitor, followed by apoptosis and luciferase reporter assays, immunoblot assays, and RT-PCR. The expression and subcellular localization of IPO7, p53, MDM2, and ribosomal proteins (RPL11 and RPL5) were studied by immunofluorescence staining and confocal microscopy. The results show that IPO7 is overexpressed in PTC and regulated by miR-7-5p. Modulation of IPO7 expression in cultured thyroid cells altered the nucleocytoplasmic shuttling of p53, MDM2, RPL11, and RPL5, in addition to the p53 protein level and activity. The expression pattern of IPO7, p53, and MDM2 in cultured thyroid cells and clinical thyroid tissue specimens confirmed the association between IPO7 overexpression and reduced p53 stability in PTC. In conclusion, the data here show that p53 level and activity are differentially controlled in malignant and benign thyroid cells through miR-7-5P/IPO7-mediated regulation of RP-MDM2-p53 nucleocytoplasmic trafficking. In PTC, downregulation of miR-7-5p with consequent overexpression of IPO7 might be a protective mechanism used by cancer cells to evade p53 growth suppression during carcinogenesis.

Keywords: MDM2; PTC; importin 7; miR-7-5p; p53.


Conflict of interest statement

The authors declare no conflict of interest.

Figures

Figure 1
Figure 1
Immunofluorescence staining images showing the protein expression of IPO7 and p53 in representative PTC and FND tissues. (A) IPO7 (red) is localized in the cytoplasm and nuclei of thyroid follicular cells in PTC samples, while it is expressed at low intensity in FND. MiR-7-5p (green) tested by in situ hybridization is negative in PTC tumor cells and strongly positive in FND. (B) Tumor cells in PTC show negative expression of p53 (green) and low cytoplasmic/nuclear expression of MDM2 (red). P53 staining was detected only in infiltrating cells in PTC tissues. In FND tissue, p53 and MDM2 showed strong cytoplasmic and nuclear expression. Nuclei were counterstained with DAPI (blue). The scale bar is shown in the bottom right panel = 20 μm. The mean fluorescence intensity was analyzed by Zen software (version 14.0.0.201, Zeiss) and presented in the pictures as overall intensity (OI).
Figure 2
Figure 2
Partial depletion of IPO7 stabilizes p53. (A) Immunoblots showing the expression of p53 in PTC cells transfected with IPO7 siRNA or the control. The bar graph shows the quantity of p53 protein measured relative to total protein. The results of three samples are shown. A significant increase in p53 protein was detected in cells treated with IPO7 siRNA (p = 0.0026). (B) Immunofluorescence images showing that p53 (green) and MDM2 (red) shift to the nuclei of PTC cells after partial IPO7 depletion (p = 0.0006 and p = 0.005, respectively). Three PTC samples were tested and images from a representative sample are shown. Nuclei were counterstained with DAPI (blue). Images were analyzed by LSM 800 and Zen software (Zeiss). The mean fluorescence intensity is presented in the pictures as overall intensity (OI). The mean nuclear localization intensity is calculated from the colocalization data. Nuclear intensity (NI) = the number of green/red pixels that colocalize with DAPI nuclear stain. The increased NI score in the treated cells indicates increased nuclear expression. NI scores across samples were analyzed using paired samples t test. The scale bar is shown in the bottom right panel = 20 μm.
Figure 3
Figure 3
Effect of partial IPO7 depletion on the cellular localization of ribosomal proteins in primary cultured PTC cells. (A) RPL11 (green) shifts from the cytoplasm to the nuclei of PTC cells in colocalization with MDM2 (red) after partial IPO7 depletion (p < 0.001 and p = 0.002, respectively). (B) RPL5 (green) and MDM2 (red) colocalize in the nuclei of PTC cells after partial IPO7 depletion (p = 0.009 and p = 0.02, respectively). Three PTC samples were tested and images from a representative sample are shown. Nuclei were counterstained with DAPI (blue). Images were analyzed by LSM 800 and Zen software (Zeiss). The mean fluorescence intensity is presented in the pictures as overall intensity (OI). The mean nuclear localization intensity is calculated from the colocalization data. Nuclear intensity (NI) = the number of green/red pixels that colocalize with DAPI nuclear stain. The increased NI score in the treated cells indicates increased nuclear expression. NI scores across samples were analyzed using paired samples t test. The yellow color in the merged pictures indicates the colocalization of the red and green fluorescence. The scale bar is shown in the bottom right panel = 20 μm.
Figure 4
Figure 4
Functional experiments in the normal thyroid cell line (Nthy-ori 3-1). Each experiment was repeated three times and results from one representative experiment are shown. (A) Nthy-ori 3-1 cells express low levels of IPO7 (green) and moderate levels of miR-7-5p (red). Transfection with miR-7-5p inhibitor increased the expression of IPO7 in the treated cells. (B) Nthy-ori 3-1 cells show nuclear expression of p53 (green) and MDM2 (red). P53 and MDM2 shifted to the cytoplasm in cells transfected with the miR-7-5p inhibitor (p = 0.01 and p < 0.001, respectively). (C) RPL11 and MDM2 are located in the cells’ nuclei. MiR-7-5p loss of function promoted the nucleocytoplasmic translocation of RPL11 and MDM2 as indicated by the reduced NI (nuclear intensity) score of the treated cells (p = 0.002 and p < 0.001, respectively). (D) RPL5 and MDM2 are located in the nuclei of cells. MiR-7-5p loss of function promoted the nucleocytoplasmic translocation of RPL5 and MDM2 (p = 0.06, p = 0.003). RPL5 retained an intense staining in the cytoplasm and nuclei of the treated cells. Nuclei were counterstained with DAPI (blue). Images were analyzed by LSM 800 and Zen software (Zeiss). The mean fluorescence intensity is presented in the pictures as overall intensity (OI). The mean nuclear localization intensity is calculated as nuclear intensity (NI) = the number of green/red pixels that colocalize with DAPI nuclear stain. NI scores across samples were analyzed using paired samples t test. The yellow color in the merged pictures indicates the colocalization of the red and green fluorescence. The scale bar is shown in the bottom right panel = 20 μm.

Similar articles

References

    1. Lim H., Devesa S.S., Sosa J.A., Check D., Kitahara C.M. Trends in Thyroid Cancer Incidence and Mortality in the United States, 1974–2013. JAMA. 2017;317:1338–1348. doi: 10.1001/jama.2017.2719. - DOI - PMC - PubMed
    1. American Cancer Society Key Statistics for Thyroid Cancer. Cancer.org|1.800.227.2345. [(accessed on 31 January 2024)]. Available online: https://www.cancer.org/cancer/types/thyroid-cancer/about/key-statistics.....
    1. Kitahara C.M., Schneider A.B. Epidemiology of Thyroid Cancer. Cancer Epidemiol. Biomark. Prev. 2022;31:1284–1297. doi: 10.1158/1055-9965.EPI-21-1440. - DOI - PMC - PubMed
    1. Wang Z., Ji X., Zhang H., Sun W. Clinical and molecular features of progressive papillary thyroid microcarcinoma. Int. J. Surg. 2024;110:2313–2322. doi: 10.1097/JS9.0000000000001117. - DOI - PMC - PubMed
    1. Vuong H.G., Altibi A.M., Abdelhamid A.H., Ngoc P.U., Quan V.D., Tantawi M.Y., Elfil M., Vu T.L., Elgebaly A., Oishi N., et al. The changing characteristics and molecular profiles of papillary thyroid carcinoma over time: A systematic review. Oncotarget. 2017;8:10637–10649. doi: 10.18632/oncotarget.12885. - DOI - PMC - PubMed

MeSH terms

Grants and funding