. 2025 Jun 18;26(12):5827.
doi: 10.3390/ijms26125827.

Dysregulation of Inositol Polyphosphate 5-Phosphatase OCRL in Alzheimer's Disease: Implications for Autophagy Dysfunction

Affiliations

Dysregulation of Inositol Polyphosphate 5-Phosphatase OCRL in Alzheimer's Disease: Implications for Autophagy Dysfunction

Kunie Ando et al. Int J Mol Sci. .

Abstract

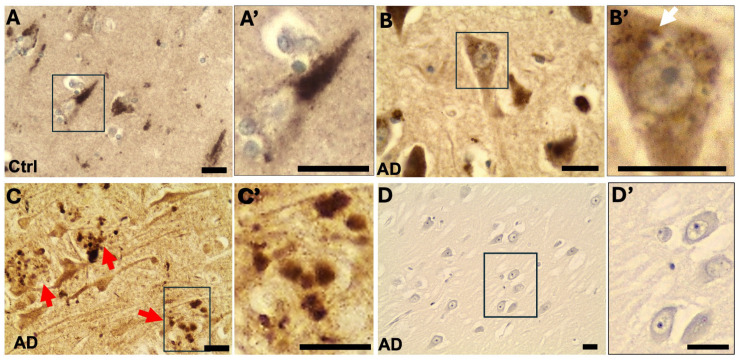
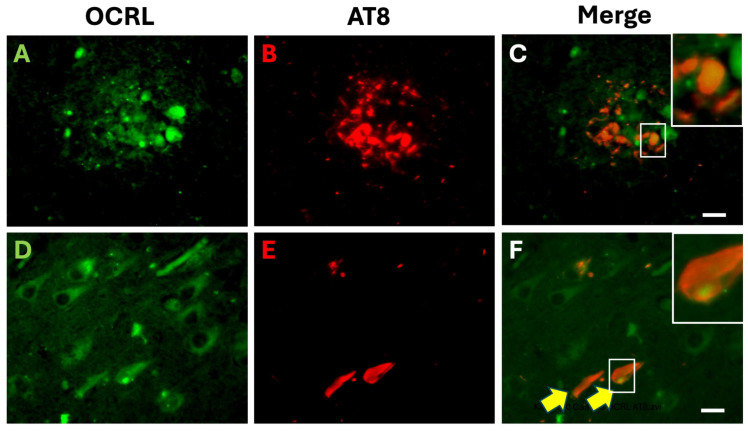
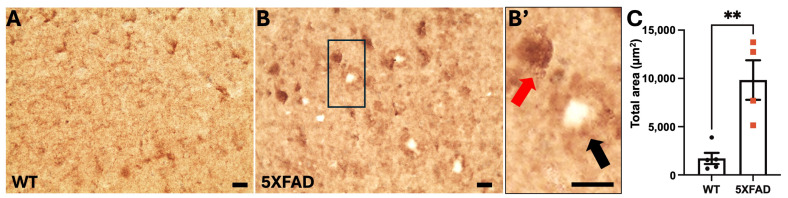
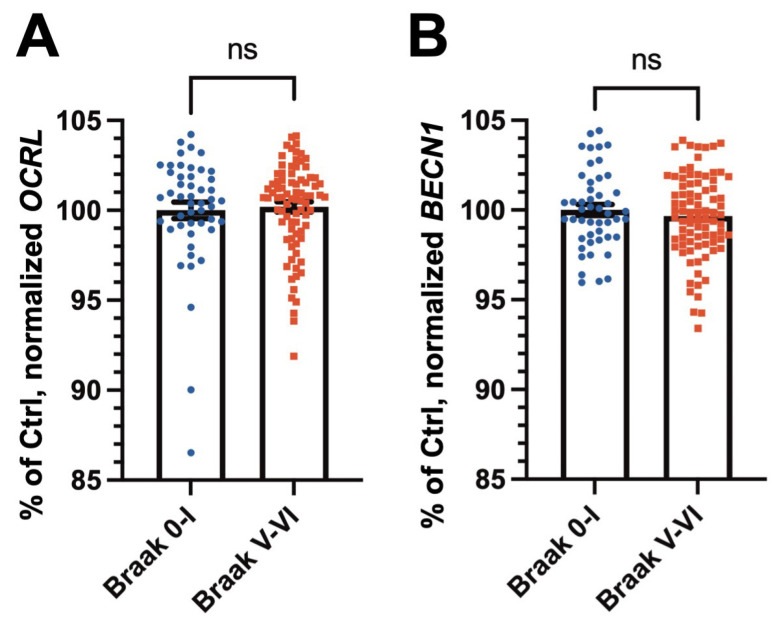
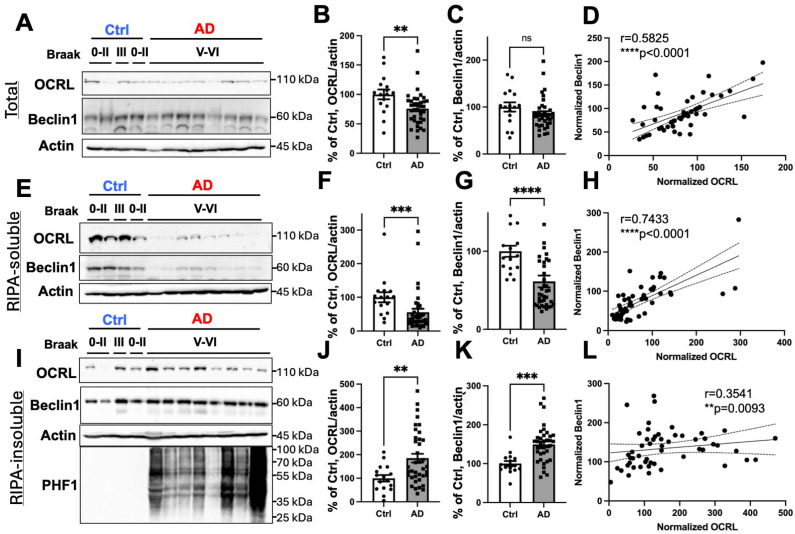
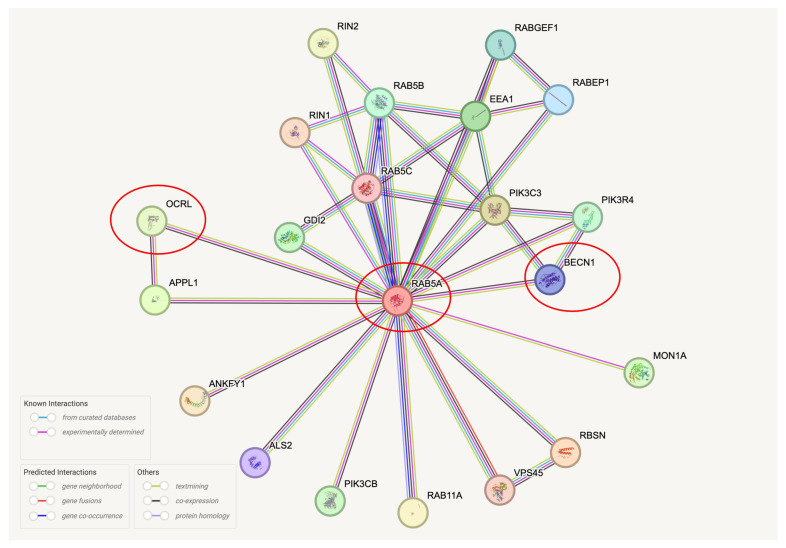
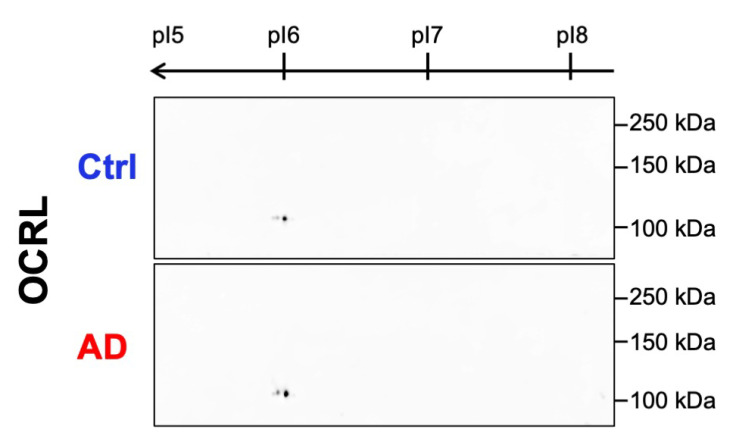
Autophagy is impaired in Alzheimer's disease (AD), particularly at the stage of autophagosome-lysosome fusion. Recent studies suggest that the inositol polyphosphate 5-phosphatase OCRL (Lowe oculocerebrorenal syndrome protein) is involved in this fusion process; however, its role in AD pathophysiology remains largely unclear. In this study, we investigated the localization and expression of OCRL in post-mortem AD brains and in a 5XFAD transgenic mouse model. While OCRL RNA levels were not significantly altered, OCRL protein was markedly reduced in the RIPA-soluble fraction and positively correlated with the autophagy marker Beclin1. Immunohistochemical analysis revealed OCRL immunoreactivity in neuronal cytoplasm, granulovacuolar degeneration bodies, and plaque-associated dystrophic neurites in AD brains. Furthermore, OCRL overexpression in a FRET-based tau biosensor cell model significantly reduced the tau-seeding-induced FRET signal. These findings suggest that OCRL dysregulation may contribute to autophagic deficits and the progression of tau pathology in AD.

Keywords: Alzheimer’s disease; Beclin1; OCRL; amyloid ß; autophagy; pTau; phosphatidylinositol; tau.


Conflict of interest statement

The authors declare no conflicts of interest.

Figures

Figure 1
Figure 1
OCRL immunostaining in the CA1-2 regions of the human hippocampus. (A) In non-demented control brains, OCRL immunoreactivity was observed as intracellular granular structures in hippocampal pyramidal neurons. (B) In AD brains, a similar granular pattern was observed. In neurons exhibiting granulovacuolar degeneration (GVD), OCRL immunoreactivity was localized to the cytoplasm surrounding membrane-bound GVD structures (white arrow in (B′)). (C) In AD brains, OCRL immunoreactivity was also detected in dystrophic neurites associated with amyloid plaques (red arrows). (D) Negative control: immunostaining of an AD brain section processed without the primary antibody. The insets (A′D′) show magnified views of the area outlined by rectangles. Sections were counterstained lightly with hematoxylin. Scale bars: 25 µm.
Figure 2
Figure 2
Double immunofluorescence staining of OCRL and pTau (AT8) in the hippocampus of an AD case. (AC) Double immunofluorescence staining shows OCRL (green) and AT8-phosphorylated tau (pTau, red) in the CA1 region of the hippocampus. Merged images reveal partial colocalization of OCRL and AT8 signals in some plaque-associated dystrophic neurites. (DF) OCRL-positive granular structures are observed in the soma of both AT8-positive (tangle-bearing, yellow arrows) and AT8-negative pyramidal neurons. Images are representative of the hippocampal CA1 region from an AD brain. The insets in (C,F) show magnified views of the area outlined by white rectangles. Scale bar, 20 µm.
Figure 3
Figure 3
OCRL accumulates in dystrophic neurites of 5XFAD mouse brains. (A,B) Representative images of OCRL immunostaining in the cortex of 10-month-old male wild-type (WT) (A) or 5XFAD (B) mice show strong OCRL immunoreactivity in plaque-associated dystrophic neurites (black arrow in (B′)) and neuronal soma (red arrow in (B′)). The inset (B′) shows magnified view of the area outlined by rectangle in (B). (C) Quantification of OCRL immunolabelling by optical density analysis revealed a significant increase in the total OCRL-positive area in 5XFAD brains compared to age- and sex-matched WT controls. Data are presented as mean ± SEM (standard error of mean). Statistical significance was determined using an unpaired t-test (WT, n = 5; 5XFAD, n = 4). ** p < 0.01. Scale bar, 25 µm.
Figure 4
Figure 4
RNA expression levels of OCRL and BECN1 in control and AD brains from the ROSMAP cohort. (A,B) No significant differences were observed in the transcript levels of OCRL (A) or BECN1 (B) between the control and AD cases. Statistical analyses were performed on normalized datasets using the Mann–Whitney U test (A) or Student’s t-test (B) following normality assessment. ns: not significant (p > 0.05).
Figure 5
Figure 5
OCRL is depleted from the RIPA-soluble fraction of AD brains and correlates with Beclin1 levels. Protein levels of OCRL, Beclin1, and the loading control actin were assessed by WB in total (A), RIPA-soluble (E), and RIPA-insoluble (I) fractions of T1 isocortex lysates from control and AD brains. (AD) In total lysates (A), OCRL levels were significantly decreased in AD brains (B), whereas Beclin1 levels showed no significant change (C). A significant positive correlation was observed between OCRL and Beclin1 in this fraction (D). (EH) In the RIPA-soluble fraction (E), both OCRL (F) and Beclin1 (G) were significantly reduced in AD brains. Their levels were strongly and positively correlated (H). (IL) In the RIPA-insoluble fraction (I), both OCRL (J) and Beclin1 (K) were significantly elevated in AD samples, with a corresponding significant positive correlation (L). The presence of phosphorylated tau was confirmed using the PHF1 antibody (I). Statistical analyses were performed on actin-normalized datasets using the Mann–Whitney U test and Spearman’s correlation. Correlation plots display the 95% confidence interval. Samples were derived from control cases (Braak stages 0–IV; n = 16) and AD cases (Braak stages V–VI; n = 38), including two familial AD (FAD) cases with amyloid precursor protein (APP) or presenilin1 (PSEN1) mutations (Supplementary Table S1). Uncropped full images of WB are shown in Supplementary Figures S2–S4. ns, not significant; ** p < 0.01; *** p < 0.001; **** p < 0.0001.
Figure 6
Figure 6
Potential indirect interaction between OCRL and Beclin1 via RAB5A. STRING analysis of protein–protein interactions suggests that OCRL and Beclin1 may be part of the same protein complex through their shared interaction with RAB5A. The analysis was performed using the STRING database (https://string-db.org/ (accessed on 1 March 2025)) on the full STRING network, with evidence-based interaction scores filtered at the highest confidence level (0.900) and a maximum of 20 proteins displayed. OCRL, Beclin1, and RAB5A are highlighted with red circles.
Figure 7
Figure 7
OCRL 2D migration profiles in control and AD brains. Representative 2D gel images showing the migration pattern of OCRL in brain samples from non-demented controls and AD cases. No significant differences in the overall migration profiles were observed between the two groups. Estimated isoelectric points (pI) are indicated.
Figure 8
Figure 8
OCRL overexpression significantly attenuates FRET-positive tau oligomers in HEK tau RD P301S FRET biosensor cells transduced with AD-PHF. (AD) Representative images of HEK Tau RD P301S FRET biosensor cells fixed 48 h after transduction. Nuclei were counterstained with DAPI. Co-transduction with the sarkosyl-insoluble fraction from a control brain and either an empty mCherry-expressing vector (A) or an mCherry-OCRL plasmid (B) did not induce FRET-positive tau inclusions. In contrast, co-transduction with AD-PHF (sarkosyl-insoluble fraction from an AD brain) and empty mCherry-expressing vector induced robust FRET-positive tau inclusions (C), which were significantly reduced in cells co-transduced with AD-PHF and mCherry-OCRL (D). (E) Quantification by FRET flow cytometry of 10,000 cells per condition showed a significant decrease in integrated mean fluorescence intensity in OCRL-overexpressing cells. Representative results of FACS cell sorting are shown in Supplementary Figure S5. Data represent three independent experiments. *** p < 0.001 by two-way ANOVA. Scale bar, 20 μm.

Similar articles

References

    1. Glenner G.G., Wong C.W. Alzheimer’s disease: Initial report of the purification and characterization of a novel cerebrovascular amyloid protein. Biochem. Biophys. Res. Commun. 1984;120:885–890. doi: 10.1016/S0006-291X(84)80190-4. - DOI - PubMed
    1. Brion J.P., Couck A.M., Passareiro E., Flament-Durand J. Neurofibrillary tangles of Alzheimer’s disease: An immunohistochemical study. J. Submicrosc. Cytol. 1985;17:89–96. - PubMed
    1. Di Paolo G., De Camilli P. Phosphoinositides in cell regulation and membrane dynamics. Nature. 2006;443:651–657. doi: 10.1038/nature05185. - DOI - PubMed
    1. Nishikawa T., Takahashi T., Nakamori M., Yamazaki Y., Kurashige T., Nagano Y., Nishida Y., Izumi Y., Matsumoto M. Phosphatidylinositol-4,5-bisphosphate is enriched in granulovacuolar degeneration bodies and neurofibrillary tangles. Neuropathol. Appl. Neurobiol. 2014;40:489–501. doi: 10.1111/nan.12056. - DOI - PMC - PubMed
    1. Morel E., Chamoun Z., Lasiecka Z.M., Chan R.B., Williamson R.L., Vetanovetz C., Dall’Armi C., Simoes S., Point Du Jour K.S., McCabe B.D., et al. Phosphatidylinositol-3-phosphate regulates sorting and processing of amyloid precursor protein through the endosomal system. Nat. Commun. 2013;4:2250. doi: 10.1038/ncomms3250. - DOI - PMC - PubMed

LinkOut - more resources