. 2025 Jun 18;26(12):5844.
doi: 10.3390/ijms26125844.

Functional Analysis of the PI3K/AKT/mTOR Pathway Inhibitor, Gedatolisib, Plus Fulvestrant with and Without Palbociclib in Breast Cancer Models

Affiliations

Functional Analysis of the PI3K/AKT/mTOR Pathway Inhibitor, Gedatolisib, Plus Fulvestrant with and Without Palbociclib in Breast Cancer Models

Aaron Broege et al. Int J Mol Sci. .

Abstract

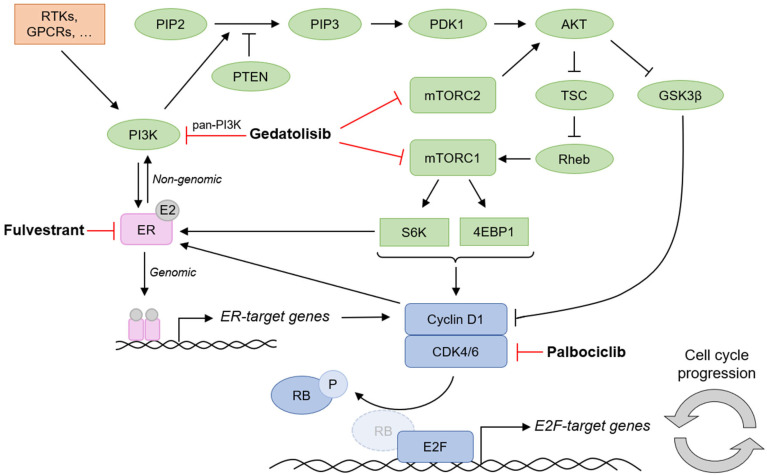
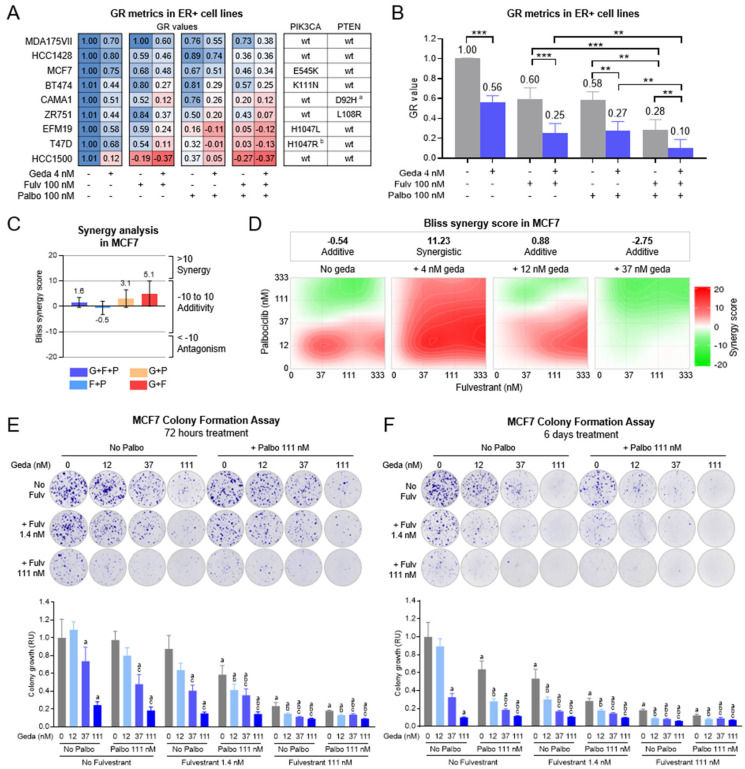
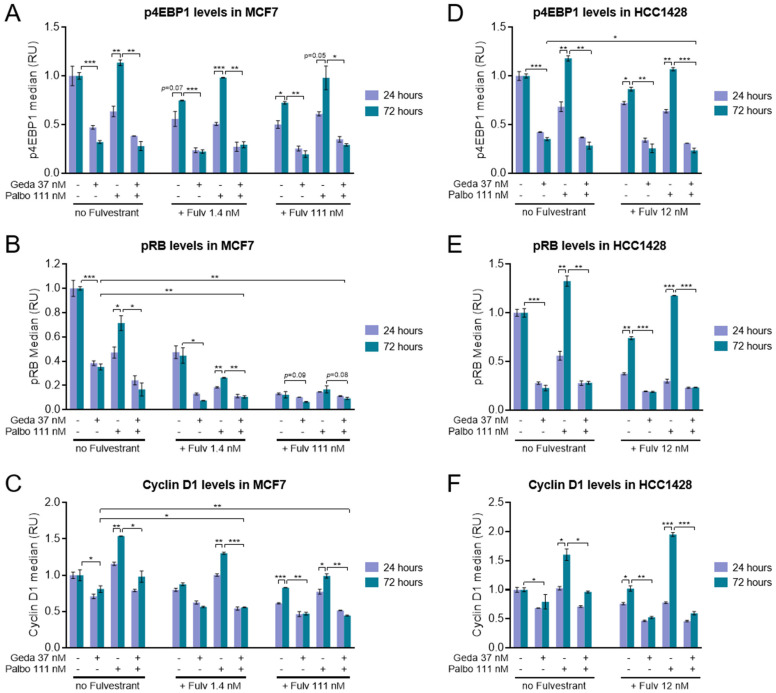
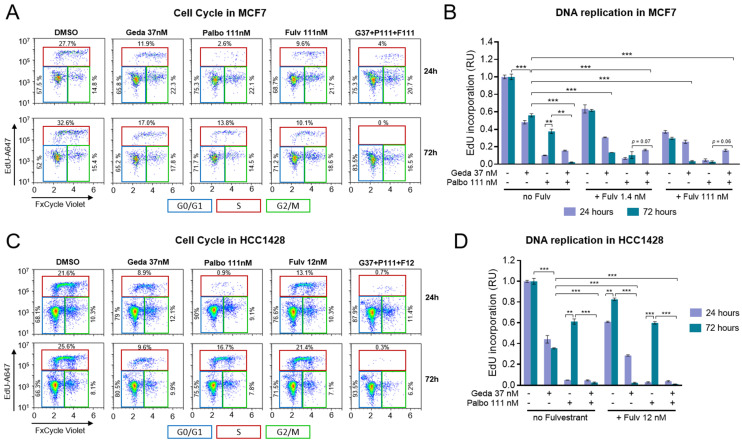
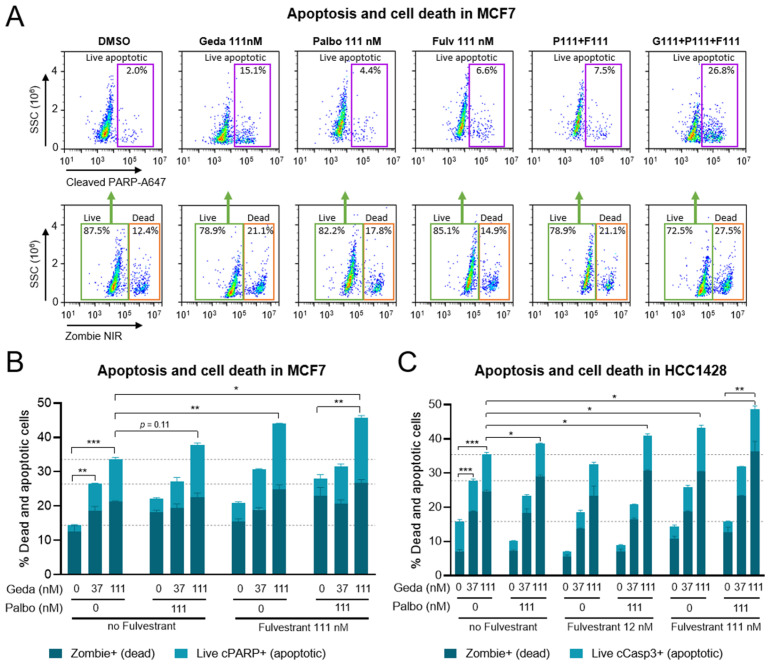
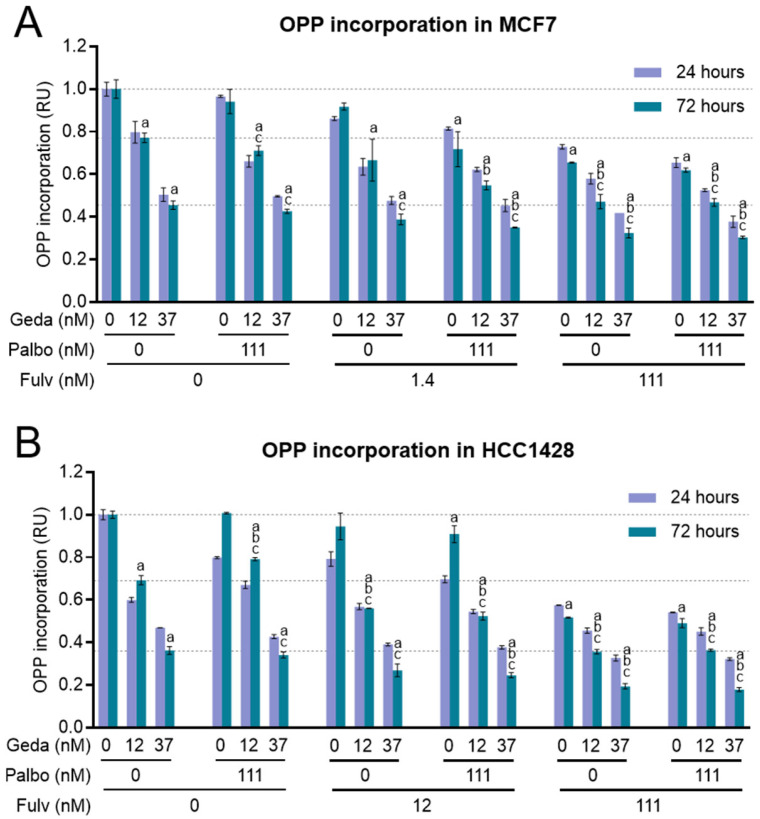
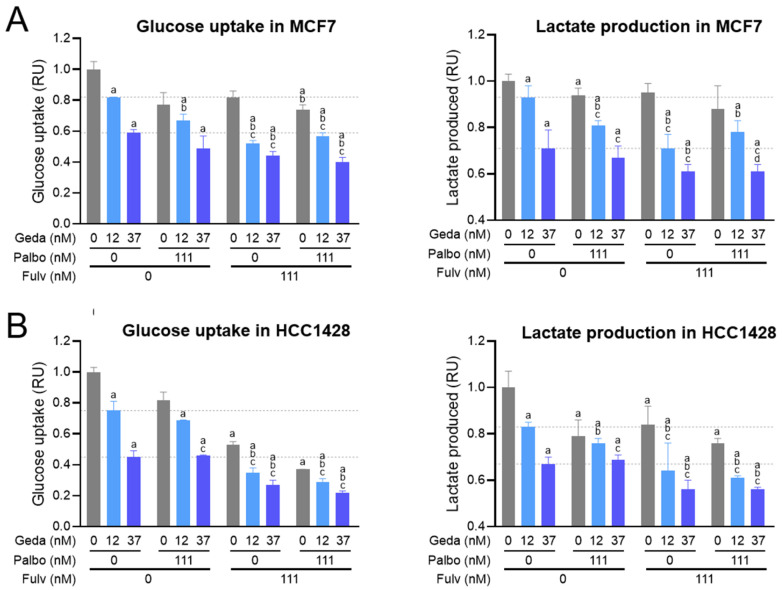
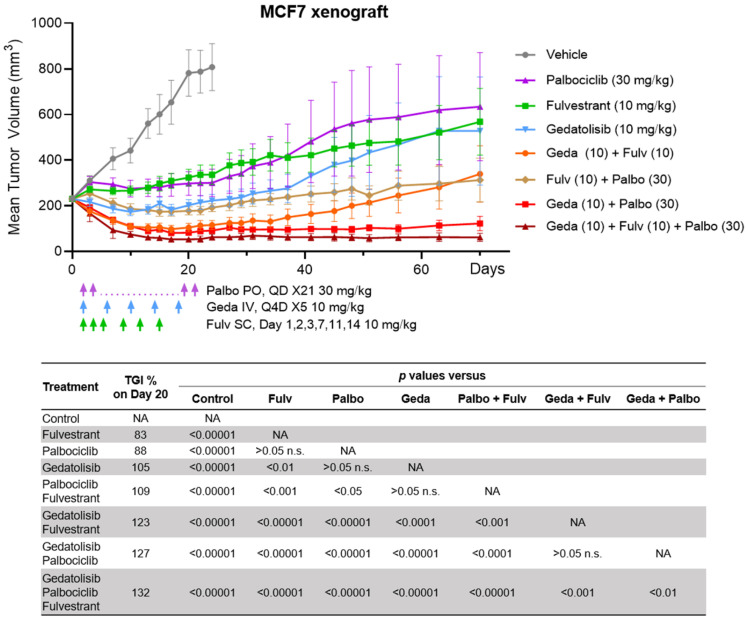
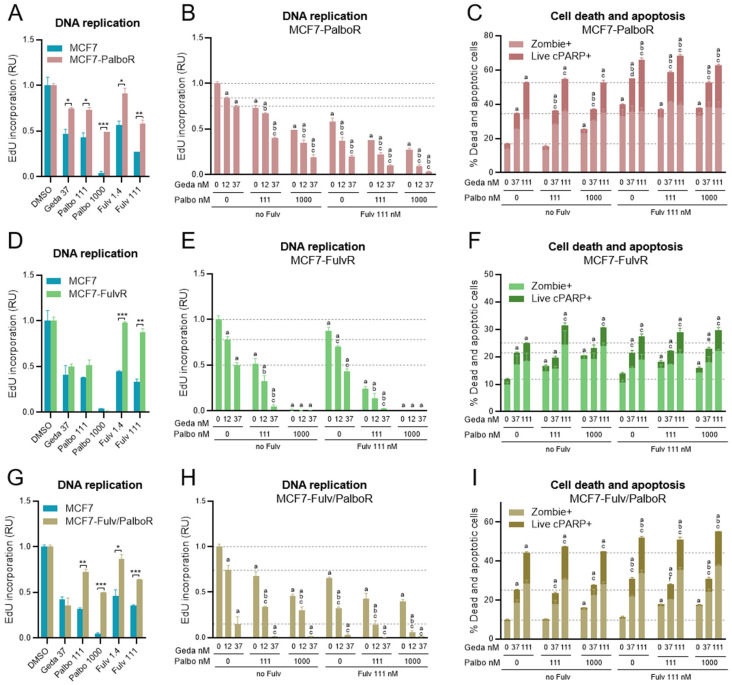
Treatment with endocrine therapy (ET) in combination with CDK4/6 inhibitors has improved the outcome of patients with hormone receptor (HR)+/HER2- advanced breast cancer (ABC), but most patients eventually experience disease progression. Since the PI3K-AKT-mTOR (PAM), estrogen receptor (ER), and cyclin-dependent kinase (CDK) pathways are interdependent drivers of HR+/HER2- breast cancer (BC), the simultaneous inhibition of these pathways is expected to enhance anti-tumor control. Here we investigated the molecular and cellular effects of gedatolisib, a multi-target kinase inhibitor of the PAM pathway currently being evaluated in Phase 3 clinical trials, combined with fulvestrant and/or palbociclib in BC cell models. We found that the gedatolisib/fulvestrant/palbociclib triplet inhibited BC cell growth significantly more than the single agents or the palbociclib/fulvestrant doublet, both in vitro and vivo. Specifically, the triplet combination counteracted adaptive responses associated with single drug treatment, such as the reactivation of the CDK-RB-E2F pathway after palbociclib treatment, and inhibited multiple cellular functions, such as cell cycle progression, cell survival, protein synthesis, and glucose metabolism. The triplet combination was effective in treatment-naïve BC cell lines as well as in cell lines adapted to palbociclib and/or fulvestrant, regardless of PIK3CA/PTEN genetic alterations. Our findings provide a mechanistic rationale for conducting clinical studies evaluating gedatolisib in combination with CDK4/6 inhibitors and ET in HR+/HER2- ABC.

Keywords: CDK4/6 inhibitors; PI3K-AKT-mTOR inhibitors; breast cancer; endocrine therapy; fulvestrant; gedatolisib; palbociclib.


Conflict of interest statement

A.B., S.R., A.S., L.D., M.S., S.S., A.M., J.M., and L.L. are all employed by and/or have ownership interest in Celcuity, Inc. A.D.L.F. was employed at Celcuity, Inc. at the time that these studies were performed and has ownership interest in Celcuity, Inc. A.S.M. is a consultant for Celcuity, Inc.

Figures

Figure 1
Figure 1
Simplified scheme illustrating the crosstalk between the PI3K-AKT-mTOR (PAM), estrogen receptor (ER), and cyclin-dependent kinase (CDK) 4/6-Retinoblastoma (RB)-E2F pathways and strategies to target these pathways in cancer cells. In response to extracellular stimuli, membrane receptors like receptor tyrosine kinases (RTKs) and G protein-coupled receptors (GPCRs) can activate PI3K, which mediates the conversion of phosphatidylinositol-4, 5-bisphosphate (PIP2) into phosphatidylinositol-3, 4, 5-triphosphate (PIP3). PIP3 accumulation triggers a phosphorylation cascade leading to the activation of multiple effectors, including AKT, which in turn affects several other downstream targets (e.g., mTORC1, GSK3). mTORC2, which also activates AKT, and PTEN, which represses PAM signaling by converting PIP3 to PIP2, are also critical PAM pathway components. The PAM pathway controls various cellular functions, including cell cycle regulation by the cyclin D1-CDK4/6-RB-E2F pathway (e.g., through 4EBP1-mediated translation of cyclin D1). The active cyclin D1-CDK4/6 complex phosphorylates RB, causing its dissociation from the E2F transcription factor; once free from RB, E2F regulates the transcription of genes involved in cell cycle progression. The PAM and CDK4/6 pathways are also interconnected with the estrogen pathway, which plays a critical role in driving cell cycle progression in ER + BC cells. Upon estrogen (E2) binding, ER promotes transcription of ER-target genes involved in multiple cellular functions, including cell cycle. ER can also act non-genomically, e.g., by non-nuclear interaction with PI3K. The crosstalk between these pathways can provide adaptive resistance mechanisms when only one pathway is inhibited. The simultaneous inhibition of the PAM pathway (e.g., with gedatolisib), the CDK4/6 pathway (e.g., with palbociclib), and the ER pathway (e.g., with fulvestrant) is expected to disrupt the cooperation between these pathways and enhance tumor growth inhibition. Scheme based on [10,11].
Figure 2
Figure 2
Dimensionality reduction and clustering of 1231 patient tumor samples based on their transcriptomes. (A,B). k-means clusters overlaid for clinical metadata corresponding to definition and PAM50 subtypes to map clusters to the biological disease progression context. (C). Combined dot plot showing pathway enrichment scores in individual clusters following GSEA analysis of Hallmark curated gene sets. NES = normalized enrichment score (NES < 0 indicate negative enrichment relative to cluster A; NES > 0 indicated positive enrichment relative to cluster A).
Figure 3
Figure 3
Growth inhibitory effects of gedatolisib plus fulvestrant and/or palbociclib in BC cell lines. (A,B). BC cell lines treated for 6 days were analyzed for growth rate (GR) inhibition by RTGlo MT cell viability assay. Individual GR values for each cell line are shown in (A). GR values between 0 and 1 indicate anti-proliferative effects; GR values = 0 indicate complete cytostatis; GR values < 0 indicate cytotoxic effects, where −1 is complete cell killing. The average GR values for all cell lines +/− SEM are shown in (B). ** p < 0.01, *** p < 0.001 by one-way ANOVA. a T47D also has PIK3CA amplification; b CAMA1 also has PTEN F278Lfs*12 mutation. wt = no driver mutations. (C,D) SynergyFinder synergy analysis of cell viability in MCF7 cells treated with gedatolisib (G) +/− fulvestrant (F) +/− palbociclib (P) for 6 days. The plot in (C) shows overall Bliss synergy scores +/− 95% CI for the various combinations of G, P, and F. Scores > 10 indicate synergy; scores between −10 and 10 indicate additivity; scores < −10 indicate antagonism. The plots in (D) show the Bliss synergy score for individual triplet combinations with no geda (i.e., F+P) or geda at 4, 12, and 37 nM. See Supplementary Data S3 for values. (E,F). Cells treated with gedatolisib, fulvestrant, and/or palbociclib for 72 h (E) or 6 days (F) were allowed to grow for a total of 2–3 weeks until colonies were visible. Colonies were stained with crystal violet (see micrograph on top) and eluted to quantify colony growth as shown in the graph at the bottom. Data represent mean +/− SEM (n = 3). a = p < 0.05 vs. DMSO; b = p < 0.05 vs. gedatolisib only; c = p < 0.05 vs. no gedatolisib within group by two-way ANOVA. See Supplementary Figure S5 for additional statistical analysis and Supplementary Data S4 for values.
Figure 4
Figure 4
Effects of the gedatolisib/fulvestrant/palbociclib triplet combination on PAM and CDK pathway activity. (AC). Flow cytometric analysis of PAM pathway activity (assessed by p4EBP1 staining) (A), CDK pathway activity (assessed by pRB staining) (B), and cyclin D1 (C) in MCF7 cells treated with the indicated concentrations of gedatolisib, fulvestrant, and/or palbociclib for 24–72 h. Data were calculated from the median fluorescence intensity in live cells and are relative to DMSO-treated cells (set as 1). (D,E). Flow cytometric analysis of p4EBP1 (D), pRB (E), and cyclin D1 (F) in HCC1428 cells as described for (AC). Data represent mean +/− SD (n = 2). * p < 0.05, ** p < 0.01, *** p < 0.001 by unpaired, two-sided t-test. See Supplementary Data S5 for values.
Figure 5
Figure 5
Effects of the gedatolisib/fulvestrant/palbociclib triplet combination on MCF7 and HCC1428 cell proliferation. (A,B). MCF7 cells were treated with the indicated concentrations of gedatolisib, fulvestrant, and/or palbociclib for 24–72 h and incubated with EdU for the last 2 h of treatment. The cell cycle phases were identified by flow cytometry analysis of EdU incorporation (EdU-A647 staining) and DNA content (FxCycle Violet staining) in Zombie-negative live cells as shown for select drug treatments in (A). Quantification of DNA replication (EdU-incorporation) is shown in (B). Data represent mean +/− SD (n = 2). (C,D). Flow cytometry analysis of cell cycle (C) and DNA replication (D) in HCC1428 treated with the indicated drugs for 24–72 h. Data represent mean +/− SD (n = 2). ** p < 0.01, *** p < 0.001 by unpaired, two-sided t-test. See Supplementary Data S6 for values.
Figure 6
Figure 6
Effects of the gedatolisib/fulvestrant/palbociclib triplet combination on MCF7 and HCC1428 cell survival. (A,B). MCF7 cells were treated with the indicated concentrations of gedatolisib, fulvestrant, and/or palbociclib for 72 h and analyzed by flow cytometry for cell death (Zombie-positive cells) and apoptosis in live cells (cleaved PARP staining in Zombie-negative cells) as shown in (A) for select conditions. Quantification of dead cells (% parent) and live apoptotic cells (% grandparents) in response to the various drug treatments is shown in (B). Data represent mean +/− SD (n = 2). (C). Flow cytometry analysis of cell death (assessed by Zombie staining) and apoptosis (assessed by cleaved Caspase 3 staining in live cells) in HCC1428 treated with the indicated drugs for 72 h. Data represent mean +/− SD (n = 2). * p < 0.05, ** p < 0.01, *** p < 0.001 by unpaired, two-sided t-test. See Supplementary Data S7 for values.
Figure 7
Figure 7
Effects of the gedatolisib/fulvestrant/palbociclib triplet on protein synthesis. (A,B). MCF7 (A) and HCC1428 (B) cells were treated with the indicated concentrations of gedatolisib, palbociclib, and/or fulvestrant for 24 or 72 h and incubated with OPP for the last 30 min of treatment. OPP incorporation into newly synthesized proteins was quantified by flow cytometry in live cells, which were gated based on Zombie staining. Data represent mean +/− SD (n = 2). a = p < 0.05 vs. DMSO; b = p < 0.05 vs. gedatolisib only; c = p < 0.05 vs. no gedatolisib within group by unpaired, two-sided t-test. See Supplementary Data S8 for values.
Figure 8
Figure 8
Effects of the gedatolisib/fulvestrant/palbociclib triplet combination on glucose metabolism. (A,B). MCF7 (A) and HCC1428 (B) cells were treated with the indicated concentrations of gedatolisib, palbociclib, and/or fulvestrant for 24 h and analyzed for glucose uptake and lactate production. Glucose uptake was quantified by Glucose uptake Glo assay, while lactate production was calculated from the lactate levels measured in the medium with the Biosen R-line instrument before and after treatment. The data shown are normalized to cell number (assessed by BCA analysis) and are relative to DMSO-treated cells (set as 1). Data represent mean +/− SD (n = 2). a = p < 0.05 vs. DMSO; b = p < 0.05 vs. gedatolisib only; c = p < 0.05 vs. no gedatolisib within group by unpaired, d = p 0.052 versus gedatolisib only; unpaired two-sided t-test. See Supplementary Data S9 for values.
Figure 9
Figure 9
In vivo efficacy of the gedatolisib/fulvestrant/palbociclib triplet. MCF7 cells were injected orthotopically into the mammary fat pad of SCID mice. Mice were treated with vehicle, fulvestrant, palbociclib, gedatolisib, or combinations thereof for 21 days, and tumors were monitored for up to 70 days. The chart on top shows mean tumor volume +/− standard error for each group (n = 10). The table at the bottom reports % tumor growth inhibition (TGI) and p-values for the individual arm (ANCOVA test). IV = Intravenous; n. s. = not significant; PO = Oral; QDx21 = once daily for 21 days; Q4Dx5 = Once every 4 days for 5 total doses; SC = Subcutaneous. See Supplementary Data S10 for individual tumor volumes.
Figure 10
Figure 10
Effects of the gedatolisib/fulvestrant/palbociclib triplet on proliferation and survival of MCF7-derived palbociclib-resistant (PalboR) or fulvestrant-resistant (FulvR) cell lines. (A,B). Cells were treated with the indicated drugs for 72 h and incubated with EdU for the last 2h of treatment. DNA replication was assessed by flow cytometry analysis of EdU incorporation. The comparison of single drug responses in parental MCF7 and MCF7-PalboR cells is shown in (A). The response to various drug combinations in MCF7-PalboR cells is shown in (B). Data represent mean +/− standard deviation (n = 2). (C). MCF7-PalboR cells treated with the indicated drug combination for 72 h were analyzed by flow cytometry for cell death (assessed by Zombie staining) and apoptosis (assessed in live, Zombie-negative cells by staining with anti-cleaved PARP). The graph shows the percentage of both dead cells (Zombie+, % parents) and apoptotic cells (live cleaved PARP+, % grandparents) as mean +/− standard deviation (n = 2). (DI). Analysis of DNA replication, cell death, and apoptosis in MCF7-FulvR (DF) and MCF7-Fulv/PalboR (GI) cells as described for (AC). For all panels: * p < 0.05, ** p < 0.01, *** p < 0.001 versus MCF7 parental cells; a, p < 0.05 vs. DMSO; b, p < 0.05 vs. gedatolisib only; c, p < 0.05 vs. no gedatolisib within group; d, p = 0.05 versus no gedatolisib within group; e, p = 0.07 versus no gedatolisib within group; f, p = 0.05 versus gedatolisib only by unpaired, two-sided t-test. Statistical analysis in (C,F) and (I) refers to the sum of dead plus live apoptotic cells. See Supplementary Data S11 for values.

Similar articles

References

    1. Glaviano A., Foo A.S.C., Lam H.Y., Yap K.C.H., Jacot W., Jones R.H., Eng H., Nair M.G., Makvandi P., Geoerger B., et al. PI3K/AKT/mTOR signaling transduction pathway and targeted therapies in cancer. Mol. Cancer. 2023;22:138. doi: 10.1186/s12943-023-01827-6. - DOI - PMC - PubMed
    1. Hoxhaj G., Manning B.D. The PI3K-AKT network at the interface of oncogenic signalling and cancer metabolism. Nat. Rev. Cancer. 2020;20:74–88. doi: 10.1038/s41568-019-0216-7. - DOI - PMC - PubMed
    1. Manning B.D., Toker A. AKT/PKB Signaling: Navigating the Network. Cell. 2017;169:381–405. doi: 10.1016/j.cell.2017.04.001. - DOI - PMC - PubMed
    1. Millis S.Z., Ikeda S., Reddy S., Gatalica Z., Kurzrock R. Landscape of Phosphatidylinositol-3-Kinase Pathway Alterations Across 19 784 Diverse Solid Tumors. JAMA Oncol. 2016;2:1565–1573. doi: 10.1001/jamaoncol.2016.0891. - DOI - PubMed
    1. Asnaghi R., Antonarelli G., Battaiotto E., Castellano G., Guidi L., Izzo D., Zagami P., Trapani D., Curigliano G. An update on promising and emerging protein kinase B/AKT inhibitors for breast cancer. Expert. Opin. Pharmacother. 2025;26:235–247. doi: 10.1080/14656566.2025.2454290. - DOI - PubMed

MeSH terms