. 2025 Jun 19;26(12):5881.
doi: 10.3390/ijms26125881.

Elucidating Regulatory Mechanisms of Genes Involved in Pathobiology of Sjögren's Disease: Immunostimulation Using a Cell Culture Model

Affiliations

Elucidating Regulatory Mechanisms of Genes Involved in Pathobiology of Sjögren's Disease: Immunostimulation Using a Cell Culture Model

Daniel D Kepple et al. Int J Mol Sci. .

Abstract

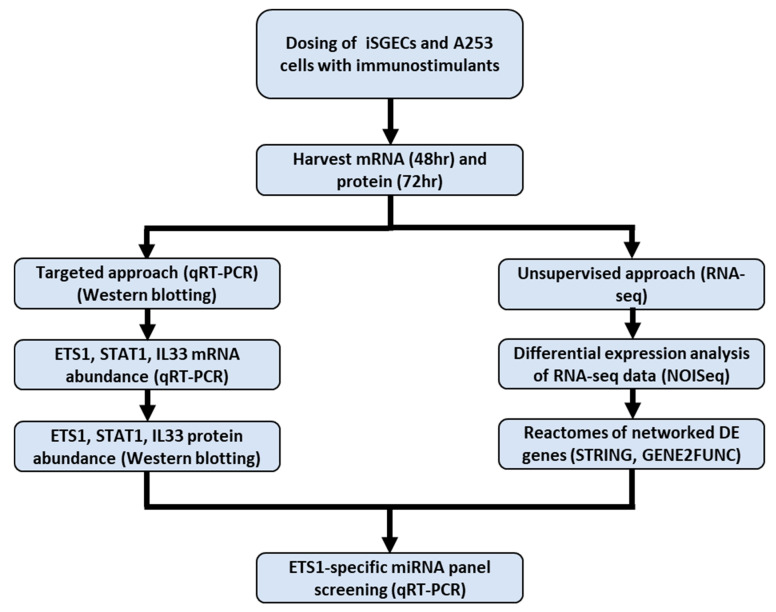
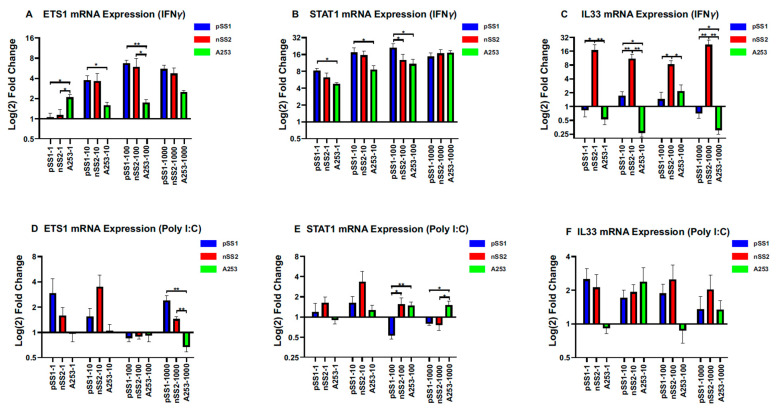
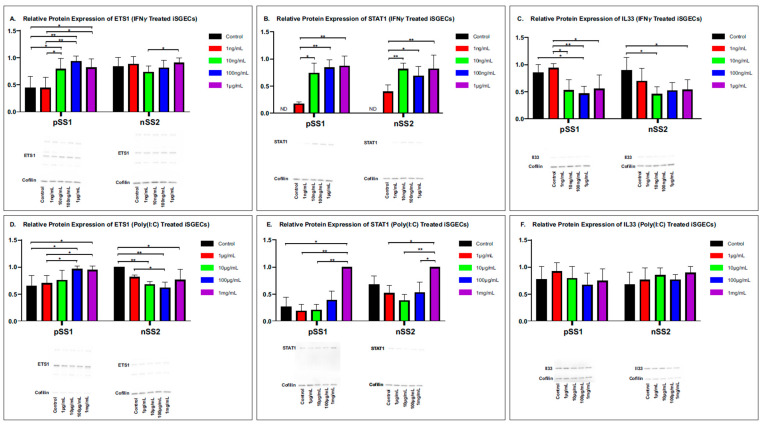
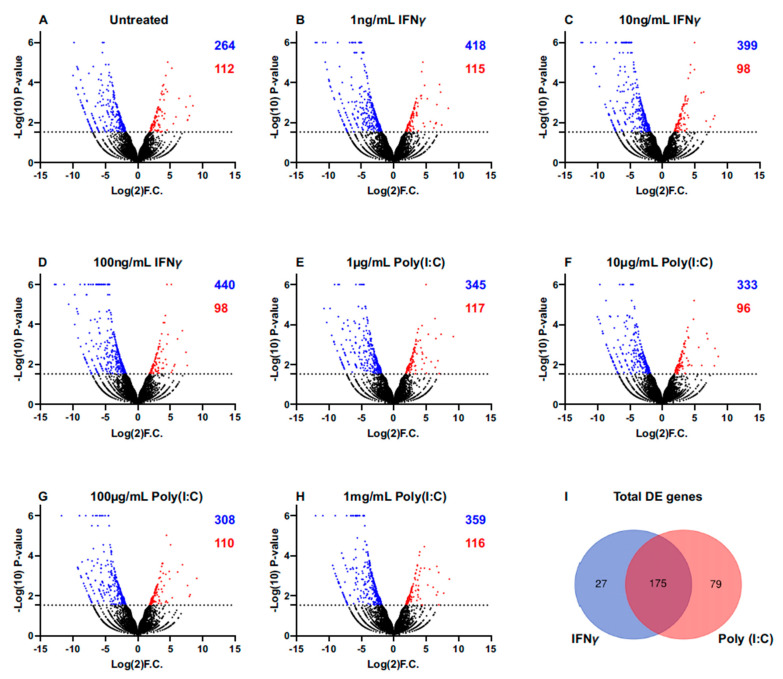
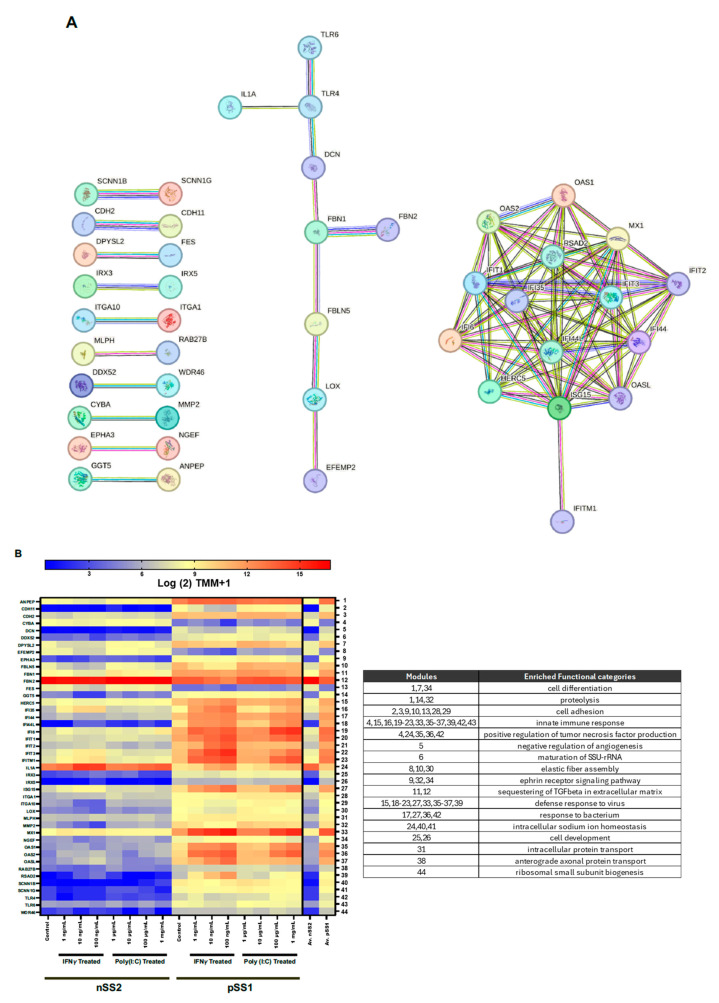
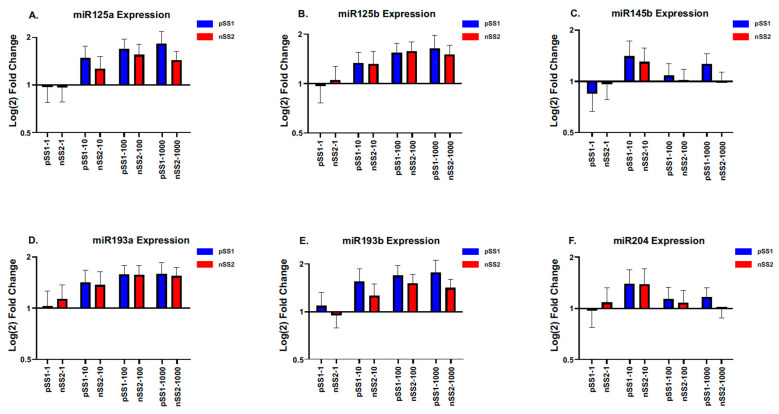
Sjögren's disease (SjD) is an autoimmune disease of exocrine tissues. Prior research has shown that ETS proto-oncogene 1 (ETS1), STAT1, and IL33 may contribute to the disease's pathology. However, the regulatory mechanisms of these genes remain poorly characterized. Our objective was to explore the mechanisms of SjD pathology and to identify dysfunctional regulators of these genes by immunostimulation of SjD and sicca relevant cell lines. We used immortalized salivary gland epithelial cell lines (iSGECs) from Sjögren's disease (pSS1) and sicca (nSS2) patients, previously developed in our lab, and control cell line A253 to dose with immunostimulants IFN-γ or poly(I:C) (0 to 1000 ng/mL and 0 to 1000 µg/mL, respectively) over a 72 h time course. Gene expression was determined using qRT-PCR delta-delta-CT method based on glyceraldehyde-3-phosphate dehydrogenase (GAPDH) for mRNA and U6 small nuclear RNA 1 (U6) for miRNA, using normalized relative fold changes 48 h post-immunostimulation. Protein expression was quantified 72 h post-stimulation by Western blotting. Reference-based RNA-seq of immunostimulated pSS1 and nSS2 cells was performed to characterize the reactome of genes conserved across all used doses. The expression of ETS1 and STAT1 protein was upregulated (p < 0.05) in IFN-γ-treated pSS1 and nSS2, as compared to A253 cells. IFN-γ-treated nSS2 cell showed significant IL33 upregulation. Also, IL33 had a correlated (p < 0.01) U-shaped response for low-mid-range doses for IFN-γ- and poly(I:C)-treated pSS1 cells. RNA-seq showed 175 conserved differentially expressed (DE) genes between nSS2 and pSS1 immunostimulated cells. Of these, 44 were shown to interact and 39 were more abundant (p < 0.05) in pSS1 cells. Western blotting demonstrated nSS2 cells expressing ETS1 uniformly across treatments compared to pSS1 cells, despite similar mRNA abundance. miR-145b and miR-193b were significantly under-expressed in IFN-γ-treated nSS2 cells compared to pSS1 cells (p < 0.01). ETS1 and IL33 showed disproportionate mRNA and protein abundances between immunostimulated Sjögren's disease-derived (pSS1), and sicca-derived (nSS2) cell lines. Such differences could be explained by higher levels of miR-145b and miR-193b present in pSS1 cells. Also, RNA-seq results suggested an increased sensitivity of pSS1 cells to immunostimulation. These results reflect current pathobiology aspects, confirming the relevance of immortalized salivary gland epithelial cell lines.

Keywords: ETS1; Interleukin-33; STAT1; Sjögren’s disease; gamma-IFN; iSGEC; miRNA; poly(I:C); regulation.


Conflict of interest statement

The authors declare no conflicts of interest.

Figures

Figure 1
Figure 1
Overall experimental design flow chart. iSGECs were incubated for 48 and 72 h post-dosing. To assess the effects of immunostimulation, we followed a targeted approach to measure mRNA and protein abundance of candidate biomarkers. We also performed an unsupervised approach to assess transcriptome-wide effects between the two cell lines. miRNA screening for ETS1-specific miRNAs followed to assess their role in protein expression.
Figure 2
Figure 2
mRNA abundance of three candidate SjD biomarkers. qRT-PCR expressional analysis comparison of three genes previously shown to contribute to Sjögren’s syndrome progression. Bar graphs represent fold-change relative to the untreated control for (A) ETS1, (B) STAT1, and (C) IL-33 of IFN-γ-treated pSS1, nSS2, and A253 cell lines, and for (D) ETS1, (E) STAT1, and (F) IL-33 of poly(I:C)-treated PSS1, NSS2, and A253 cell lines. Expression levels were determined relative to GAPDH based on the ∆∆CT method using SYBR Green mix. Error bars represent means (±) standard error (SE) based on nine independent experimental replicates. Shapiro–Wilk’s test was used to determine data distribution. Mann–Whitney U-test (Bonferroni-corrected) was used to determine significance (** p < 0.01; * p < 0.05).
Figure 3
Figure 3
Protein abundance of three candidate SjD biomarkers. Active protein expression analysis of salivary gland cell lines treated with (AC) IFN-γ and (DF) Poly(I:C). Representative Western blots and semi-quantitative Western blot analysis (from 5 independent experimental replicates) are shown. Protein levels were determined 72 h post-dosing with IFN-γ and Poly(I:C) in pSS1 and nSS2 whole-cell lysates. Equal protein amounts were loaded in each lane and target bands were normalized to protein expression of cofilin. Error bars represent the mean (±) standard deviation. Loading controls and target proteins of the same blot were individually optimized for exposure requirements and reconstituted for imaging. Mann–Whitney U-test was used to determine significance between treatments (** p < 0.01; * p < 0.05). ND is not detected.
Figure 4
Figure 4
NOISeq differential expression analysis of immunostimulated nSS2 vs. pSS1 cell lines. (AH) Volcano plots based on the NOISeq DE analyses comparing differentially expressed genes between nSS2 and pSS1 cell lines in the presence of (A) sham; (B) 1 ng/mL IFN-γ; (C) 10 ng/mL IFN-γ; (D) 100 ng/mL IFN-γ; (E) 1 µg/mL Poly(I:C); (F) 10 µg/mL Poly(I:C); (G) 100 µg/mL Poly(I:C); and (H) 1 mg/mL Poly(I:C) (p < 0.03). Blue dots represent single genes that are downregulated in comparison, while red dots represent upregulated genes by comparison. pSS1 cells showed about a 4-fold increase with IFN-γ treatments and about a 3-fold increase with Poly(I:C) treatments in upregulated DE genes compared to nSS2 cells. (I) Venn diagram showing conserved DE genes between the control and IFN-γ treatments (blue), and the control and Poly(I:C) treatments (red). In total, there were 175 conserved DE genes between all treatments and control.
Figure 5
Figure 5
Network and mRNA abundance of conserved DE genes. (A) STRING network of DE genes conserved amongst all treatment groups and the control. Disconnected nodes were removed from the analysis. (B) Heat map showing expression of DE genes conserved amongst all treatment groups and the control. Genes are arranged in alphabetical order by their gene symbol and categorized by enriched gene ontology. Overall, most genes were shown to be upregulated in pSS1 cells except for CYBA, EFEMP2, FBN2, FES, and IL1A, involved in innate immunity, ECM integrity, cell adhesion, and homeostasis. Genes that demonstrated higher levels of interaction (i.e., more than one interaction) were all upregulated in pSS1 cells.
Figure 6
Figure 6
Abundance of ETS1-inhibiting miRNAs. Bar graphs represent fold-change relative to the control for (AC) IFNγ-treated and (DF) Poly(I:C)-treated pSS1 and nSS2 cell lines. Expression levels were determined relative to U6 based on the ∆∆CT method using SYBR Green mix. Error bars represent mean (±) standard error (SE) based on 15 independent experimental replicates. Mann–Whitney U-test was used to determine significance between treatment groups and a Wilcoxon signed-rank test was used to determine significance between pSS1 and nSS2 cell lines. Of interest, miR193b showed consistently higher expression in pSS1 cells and was highly significant (p < 0.01).

Similar articles

References

    1. Carsons S.E., Patel B.C. StatPearls. StatPearls Publishing; Treasure Island, FL, USA: 2022. [(accessed on 1 August 2022)]. Sjogren Syndrome. Available online: https://www.ncbi.nlm.nih.gov/books/NBK431049/
    1. Tarn J., Lendrem D., McMeekin P., Lendrem C., Hargreaves B., Ng W.F. Primary Sjögren’s syndrome: Longitudinal real-world, observational data on health-related quality of life. J. Intern. Med. 2022;291:849–855. doi: 10.1111/joim.13451. - DOI - PMC - PubMed
    1. Both T., Dalm V.A., van Hagen P.M., van Daele P.L. Reviewing primary Sjögren’s syndrome: Beyond the dryness—From pathophysiology to diagnosis and treatment. Int. J. Med. Sci. 2017;14:191–200. doi: 10.7150/ijms.17718. - DOI - PMC - PubMed
    1. McCoy S.S., Sampene E., Baer A.N. Association of Sjögren’s Syndrome With Reduced Lifetime Sex Hormone Exposure: A Case-Control Study. Arthritis Care Res. 2020;72:1315–1322. doi: 10.1002/acr.24014. - DOI - PMC - PubMed
    1. Parisis D., Chivasso C., Perret J., Soyfoo M.S., Delporte C. Current State of Knowledge on Primary Sjögren’s Syndrome, an Autoimmune Exocrinopathy. J. Clin. Med. 2020;9:2299. doi: 10.3390/jcm9072299. - DOI - PMC - PubMed

MeSH terms