Comparative Study
. 2025 Jun 19;26(12):5906.
doi: 10.3390/ijms26125906.

Comparison Bioinformatic Analysis of Extracellular Vesicles-Related Genes and MicroRNAs in Breast Cancer

Affiliations
Comparative Study

Comparison Bioinformatic Analysis of Extracellular Vesicles-Related Genes and MicroRNAs in Breast Cancer

Durmus Ayan et al. Int J Mol Sci. .

Abstract

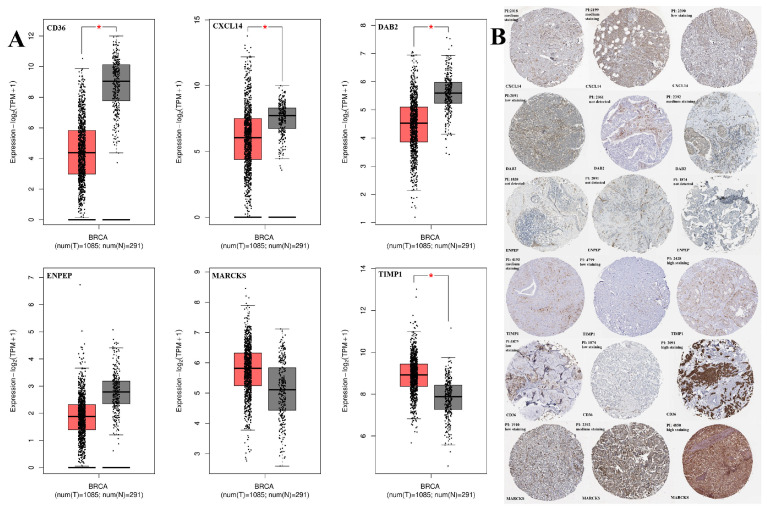
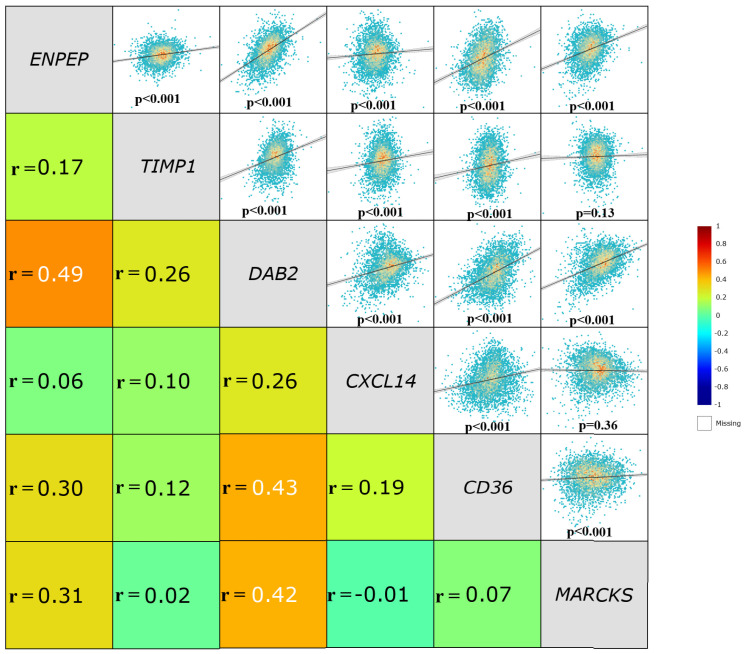
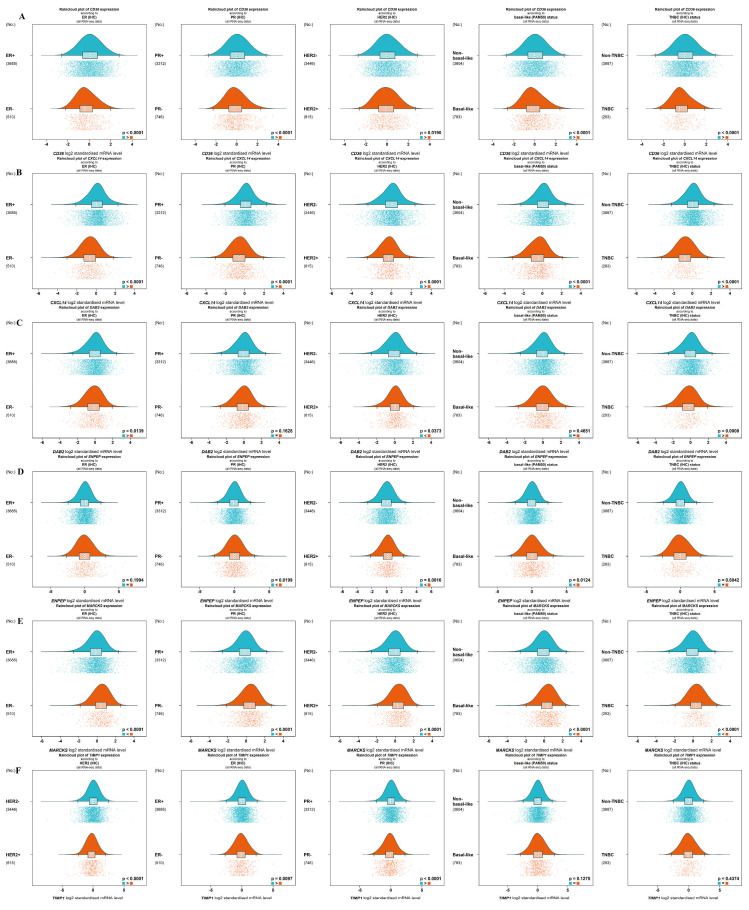
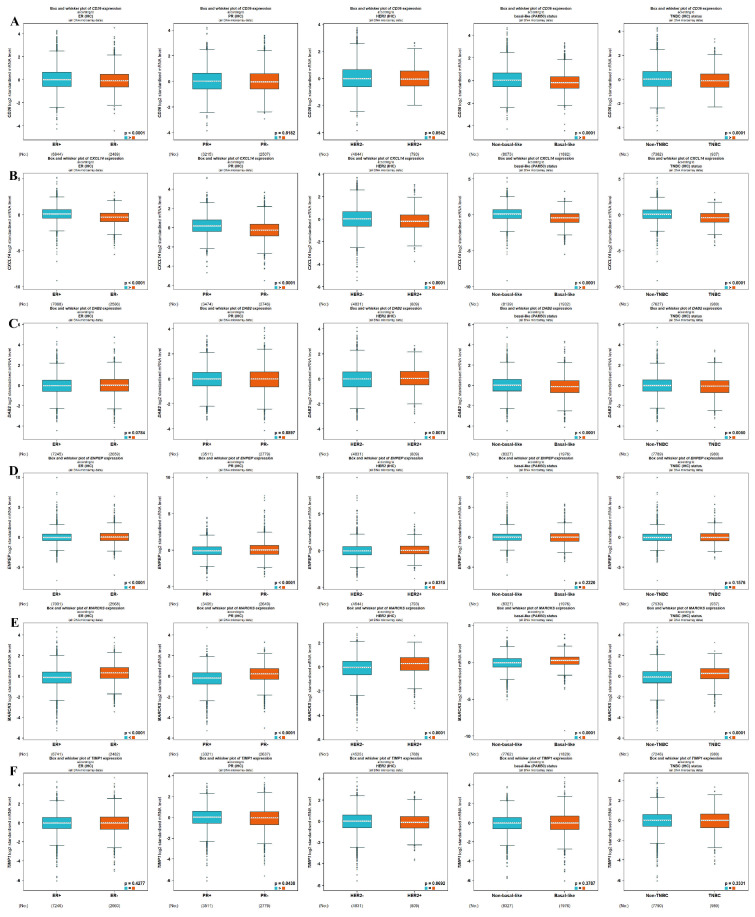
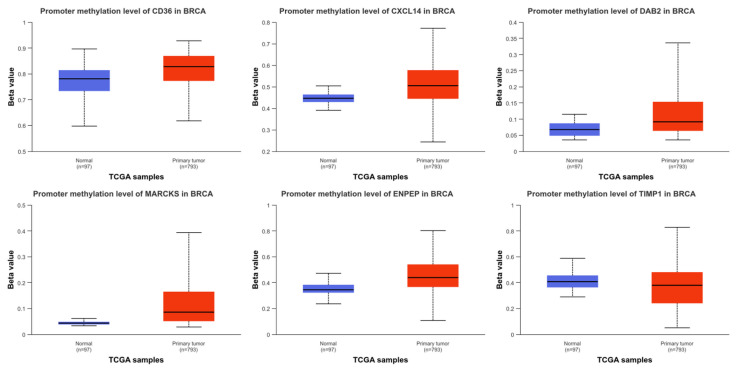
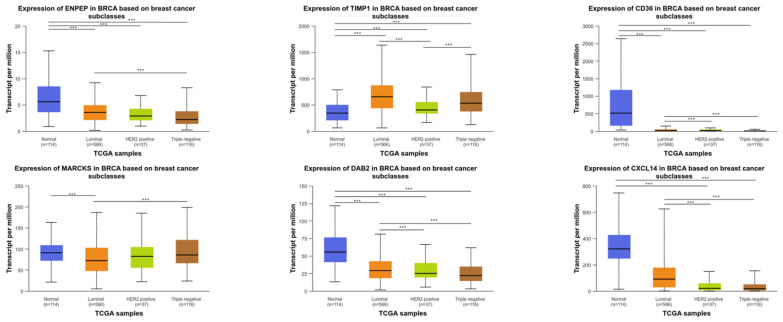
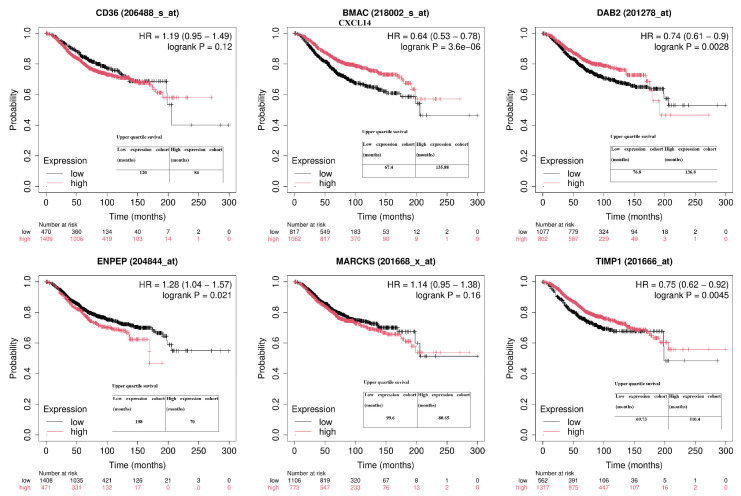
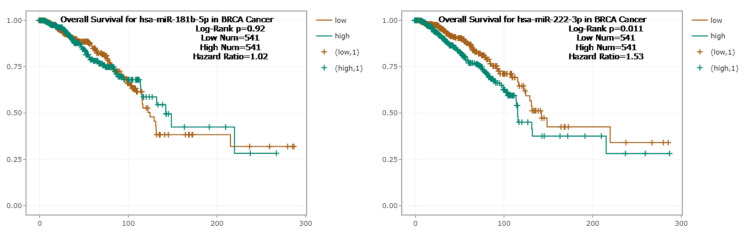
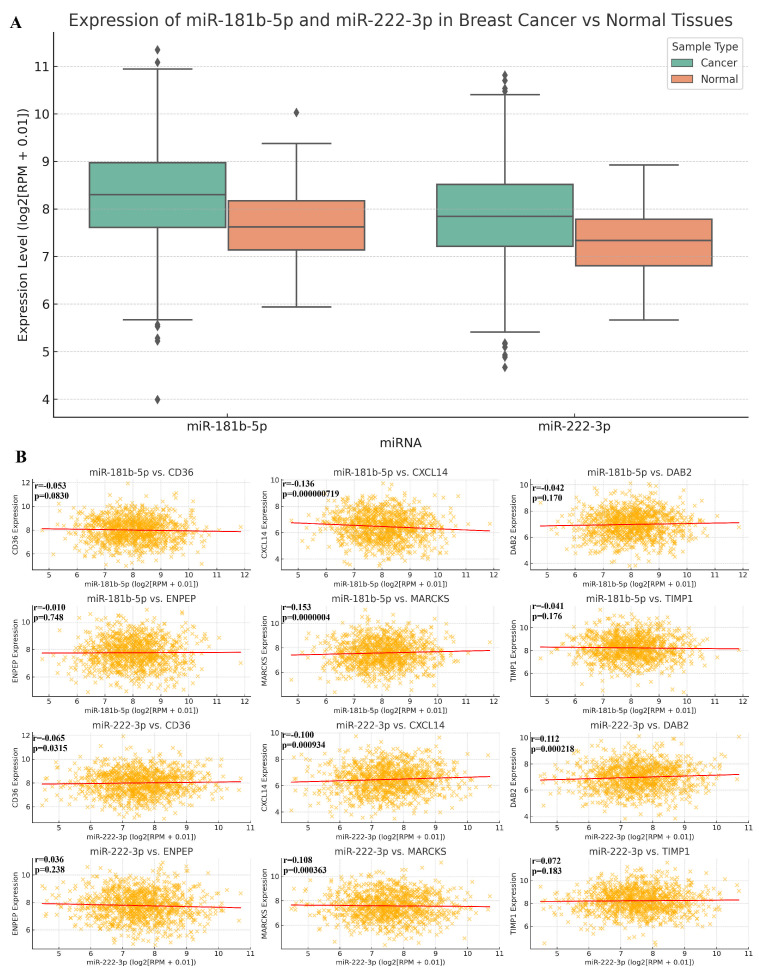
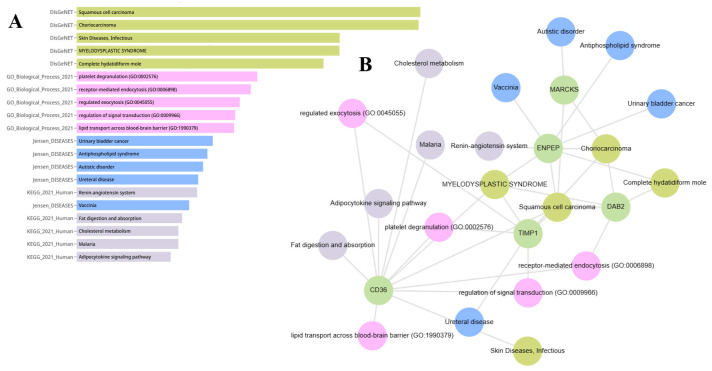
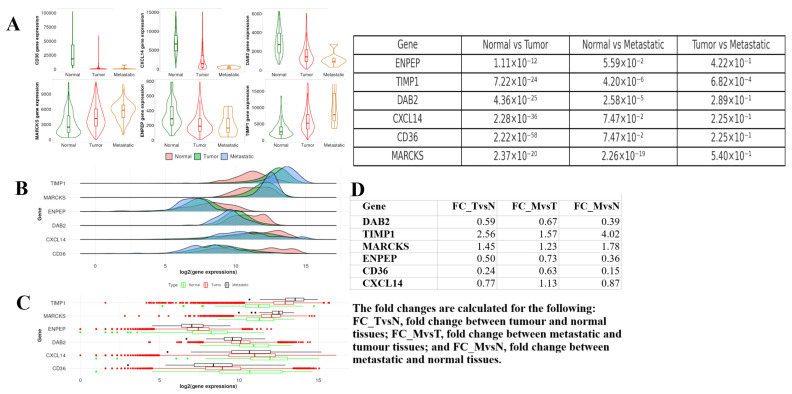
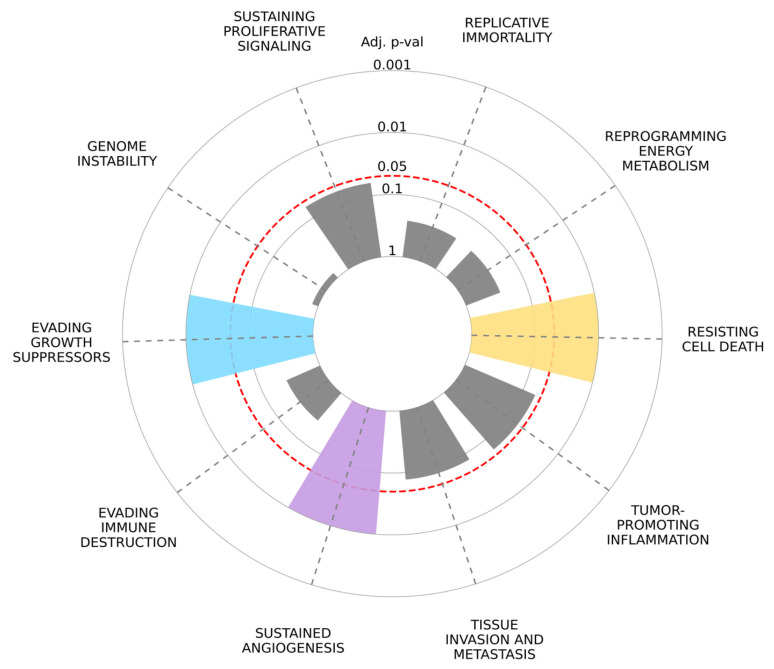
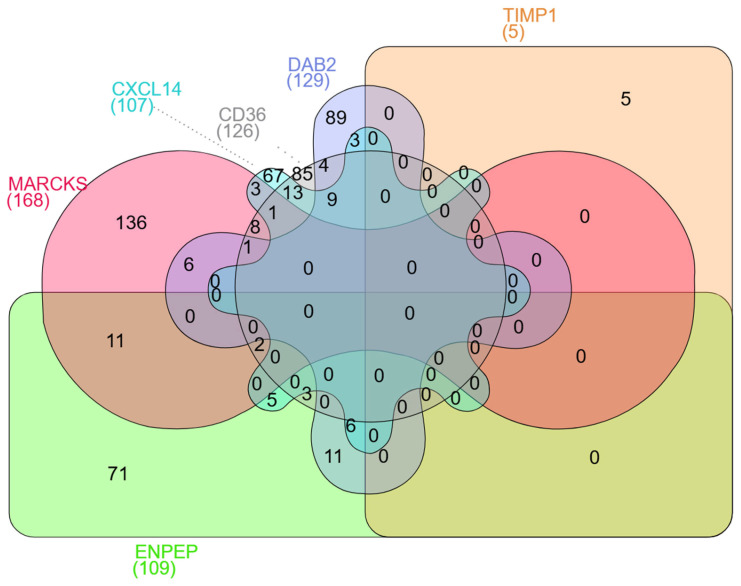
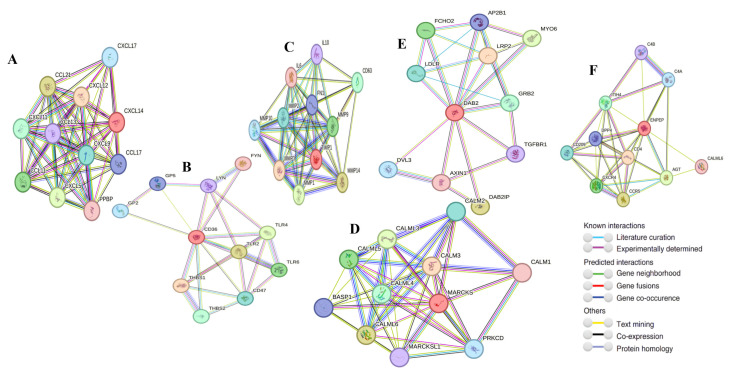
Breast cancer (BC) remains a leading cause of cancer-related mortality in women, with treatment challenges due to the lack of targeted therapies. Extracellular vesicles (EVs) play a crucial role in BC progression by carrying bioactive molecules. This study analyzed EV-associated molecules (ENPEP, TIMP1, CD36, MARCKS, DAB2, CXCL14, miR-181b-5p, miR-222-3p) using bioinformatics tools. We used GEPIA2; Human Protein Atlas (HPA) 24.0; bc-GenExMiner v5.1; UALCAN 2022; Kaplan-Meier plotter 2025; ENCORI database v2.0; Enrichr-KG web tool 2021; Cancer Hallmark Enrichment tool 2025; Tumor, Normal, and Metastatic (TNM) plot database 2025; MicroRNA Target Prediction Database 6.0; TargetScan 8.0; and STRING database 12.0. CD36, DAB2, and CXCL14 were significantly downregulated, while TIMP1 was upregulated in BC tissues (p < 0.05). CD36, CXCL14, and DAB2 were predominantly low in triple-negative and basal-like subtypes, whereas TIMP1 was higher in HER2+, ER+, and PR+ tumors (p < 0.01). These changes correlated with promoter methylation patterns. Higher TIMP1, DAB2, and CXCL14 levels were associated with improved overall survival (p < 0.05). miR-222-3p was downregulated and positively correlated with TIMP1 and DAB2, while miR-181b-5p was upregulated and negatively correlated with CXCL14. TNM analysis confirmed these expression changes. Functional enrichment linked these molecules to key cancer hallmarks, including proliferation and angiogenesis. CD36, DAB2, CXCL14, TIMP1, miR-222-3p, and miR-181b-5p may serve as biomarkers for BC pathogenesis and potential therapeutic targets. Further studies are needed to validate these findings.

Keywords: biomarkers; breast cancer; extracellular vesicles.


Conflict of interest statement

The authors declare no conflicts of interest.

Figures

Figure 1
Figure 1
(A) Boxplot of the ENPEP, TIMP1, CD36, MARCKS, DAB2, and CXCL14 gene expression results in breast cancer were demonstrated via GEPIA2 webtool. * p < 0.05 is statistically significant. Each point represents an individual sample (n = 1085 tumor samples, 291 normal tissues) based on RNA-seq data from the TCGA-BRCA and GTEx datasets accessed via the GEPIA2 platform. BC tissue (red) and normal breast tissues (gray). (B) Validation of the genes using the Human Protein Atlas (HPA) database.
Figure 2
Figure 2
The correlations of the examined genes with each other. Spearman correlation of the examined genes with each other in breast cancer tissues (n = 1085). Data were retrieved from TCGA-BRCA and analyzed using the ENCORI database.
Figure 3
Figure 3
All RNA-seq data results according to receptor status (ER, PR, HER2) and intrinsic molecular subtypes (TNBC and basal-like): (A) CD36, (B) CXCL14, (C) DAB2, (D) ENPEP, (E) MARCKS, (F) TIMP1.
Figure 4
Figure 4
All DNA microarrays data results according to receptor status (ER, PR, HER2) and intrinsic molecular subtypes (TNBC and basal-like): (A) CD36, (B) CXCL14, (C) DAB2, (D) ENPEP, (E) MARCKS, (F) TIMP1.
Figure 5
Figure 5
Boxplots showing the promoter methylation levels (beta values) of CD36, CXCL14, DAB2, MARCKS, ENPEP, and TIMP1 in BRCA samples. Methylation data were obtained from The Cancer Genome Atlas (TCGA) using the UALCAN platform. Comparisons were made between normal breast tissues (n = 97) and primary tumor tissues (n = 793). Beta values range from 0 (unmethylated) to 1 (fully methylated).
Figure 6
Figure 6
Boxplots showing the transcript per million (TPM) expression levels of ENPEP, TIMP1, CD36, MARCKS, DAB2, and CXCL14 across different breast cancer molecular subtypes: luminal, HER2-positive, triple-negative, and normal tissues. Expression data were obtained from The Cancer Genome Atlas (TCGA) using the UALCAN platform. The number of samples in each group is indicated: normal (n = 114), luminal (n = 611), HER2-positive (n = 82), and triple-negative (n = 120). Asterisks denote statistically significant differences (p < 0.05) between the indicated groups.
Figure 7
Figure 7
Kaplan–Meier overall survival analysis for six extracellular vesicle (EV)-associated genes: CD36, CXCL14, DAB2, ENPEP, MARCKS, and TIMP1. Patients were divided into high- and low-expression groups based on the median expression threshold. Survival curves were generated using the KM-Plotter 2025 tool utilizing Affymetrix probe data for BRCA patients (n ≈ 1900 total). Hazard ratios (HRs), 95% confidence intervals (CIs), and log-rank p-values are shown for each gene.
Figure 8
Figure 8
Kaplan–Meier overall survival analysis for hsa.miR-222-3p expression in breast cancer patients. A total of 1082 samples were analyzed using the KM-Plotter database, with patients divided into high- and low-expression groups based on the median cutoff.
Figure 9
Figure 9
(A) Boxplots showing the differential expression levels of hsa-miR-181b-5p and hsa-miR-222-3p in breast cancer tissues (n = 1085) compared to normal breast tissues (n = 104) based on ENCORI project data. Expression is presented in log2(RPM + 0.01). (B) Correlation analysis between hsa-miR-181b-5p or hsa-miR-222-3p and selected EV-associated target genes (CD36, CXCL14, DAB2, ENPEP, MARCKS, TIMP1) in BRCA samples (n = 1085). Pearson correlation coefficients (r) and p-values are shown. Data were obtained from the ENCORI database. Each dot represents an individual sample.
Figure 10
Figure 10
(A) Bar chart representing the top enriched biological processes, molecular functions, and signaling pathways associated with the selected EV-related genes (ENPEP, TIMP1, CD36, MARCKS, DAB2, CXCL14), as identified through functional annotation using the Enrichr-KG and Cancer Hallmarks Enrichment platforms. Categories include GO terms, KEGG pathways, and hallmark gene sets. (B) Network visualization showing the association of EV-related genes with enriched disease phenotypes and biological functions based on integrated enrichment analysis. Nodes represent genes (green), pathways or biological processes (pink/lavender), and disease terms (blue), with edges indicating reported associations from curated databases. This network suggests shared functional roles and pathological relevance of these EV cargo molecules in cancer-related and immune-modulatory processes.
Figure 11
Figure 11
(A) Violin plots displaying the expression levels of the selected genes (ENPEP, TIMP1, DAB2, CXCL14, CD36, MARCKS) across normal, tumor, and metastatic samples. Dunn’s test was performed to assess significant differences between groups, with p-values indicated above each plot. (B) Density plots showing the distribution of gene expression values for each gene across the three sample types (normal, tumor, metastatic). (C) Boxplots illustrate the gene expression values across normal, tumor, and metastatic groups. Outliers are indicated by red and green dots, representing significant differences in expression between sample groups. (D) Multivariate Cox regression analysis results displaying the fold changes in gene expression for DAB2, TIMP1, MARCKS, ENPEP, CD36, and CXCL14 across normal versus tumor tissues (FC_TvsN), normal versus metastatic tissues (FC_MvsN), and tumor versus metastatic tissues (FC_MvsT).
Figure 12
Figure 12
Radial bar plot illustrating the enrichment significance of cancer hallmark pathways associated with the selected EV-related genes. Each bar represents an individual hallmark process, with bar height indicating the adjusted p-value (log scale) derived from enrichment analysis. Hallmarks such as evading growth suppressors, evading immune destruction, resisting cell death, and sustained angiogenesis were significantly enriched (adjusted p < 0.05, highlighted in color). The red dashed line denotes the 0.05 significance threshold. Data were obtained using the Cancer Hallmark Enrichment 2025 tool based on curated gene sets linked to breast cancer pathogenesis.
Figure 13
Figure 13
Venn diagram illustrates the overlap of predicted target genes for six EV-associated genes: MARCKS (168 targets), CXCL14 (107), CD36 (126), DAB2 (129), ENPEP (109), and TIMP1 (5). Numbers indicate the count of shared miRNAs among different combinations of these molecules.
Figure 14
Figure 14
Gene–gene interaction analysis result for CXCL14 (A), CD36 (B), TIMP1 (C), MARCKS (D), DAB2 (E), ENPEP (F).

Similar articles

References

    1. Lopez-Gonzalez L., Sanchez C.A., Sanchez C.C., Roberts C.E., Espinosa J., Pekarek T., Fraile-Martinez O., García-Montero C., Rodriguez-Slocker A.M., Jiménez-Álvarez L., et al. Exploring Biomarkers in Breast Cancer: Hallmarks of Diagnosis, Treatment, and Follow-Up in Clinical Practice. Medicina. 2024;60:168. doi: 10.3390/medicina60010168. - DOI - PMC - PubMed
    1. Wilkinson L., Gathani T. Understanding breast cancer as a global health concern. Br. J. Radiol. 2022;95:20211033. doi: 10.1259/bjr.20211033. - DOI - PMC - PubMed
    1. Panigrahi L., Samal P., Sahoo S., Sahoo B., Kumar P.A., Mahanta S., Rath S.K., Arakha M. Nanoparticle-mediated diagnosis, treatment, and prevention of breast cancer. Nanoscale Adv. 2024;6:3699–3713. doi: 10.1039/D3NA00965C. - DOI - PMC - PubMed
    1. Zhang X., Wang C., Yu J., Bu J., Ai F., Wang Y., Lin J., Zhu X. Extracellular vesicles in the treatment and diagnosis of breast cancer: A status update. Front. Endocrinol. 2023;14:1202493. doi: 10.3389/fendo.2023.1202493. - DOI - PMC - PubMed
    1. Bandu R., Oh J., Kim K. Extracellular vesicle proteins as breast cancer biomarkers: Mass spectrometry-based analysis. Proteomics. 2024;24:2300062. doi: 10.1002/pmic.202300062. - DOI - PubMed

Publication types

MeSH terms