. 2025 May 22;16(6):613.
doi: 10.3390/genes16060613.

Heterorhabditis bacteriophora Extracellular Vesicles Alter the Innate Immune Signaling in Drosophila melanogaster

Affiliations

Heterorhabditis bacteriophora Extracellular Vesicles Alter the Innate Immune Signaling in Drosophila melanogaster

Duarte Toubarro et al. Genes (Basel). .

Abstract

Background:Heterorhabditis bacteriophora entomopathogenic nematodes are commonly used in agricultural practices for the biological control of insect pests. These parasites are also used in basic research for unveiling the molecular basis of nematode parasitism in relation to the insect anti-nematode response. We have recently shown that H. bacteriophora excreted-secreted products reduce the expression of the antimicrobial peptide gene Diptericin in Drosophila melanogaster, which increases fly mortality due to enhanced propagation of the mutualistic bacteria Photorhabdus luminescens. However, the effect of entomopathogenic nematode extracellular vesicles (EVs) on the insect host defense remains unknown. Methods: Here, we injected adult flies with H. bacteriophora EVs and used quantitative RT-PCR together with gene-specific primers to analyze the activity of immune-related signaling pathways. Results: We found that H. bacteriophora EVs are lethal to Drosophila melanogaster, and they downregulate the expression of Attacin, Cecropin, and Prophenoloxidase 3 in adult flies. Conclusions: These findings build on previous knowledge and strengthen the notion that H. bacteriophora entomopathogenic nematodes release a variety of effector molecules to modify the insect's innate immune signaling. This information is important because it contributes toward clarifying the molecular interplay between entomopathogenic nematode components and the host's innate immune system.

Keywords: Drosophila; Heterorhabditis; immune gene expression; immune signaling; infection; innate immunity.


Conflict of interest statement

The authors declare no conflicts of interest.

Figures

Figure 1
Figure 1
Chromatogram of concentrated ES products from the 100 kDa MW loaded onto a Sepharose CL-2B gel filtration column. The first peak (red bars) observed between fractions H3 and H7 represents the EV-rich fraction, which was collected for downstream NTA analysis. The second peak (blue bars), detected between fractions H13 and H21, corresponds to soluble proteins without vesicles. The dotted line represents the protein concentration profile across the chromatographic fractions.
Figure 2
Figure 2
Nanoparticle Tracking Analysis of purified extracellular vesicles from H. bacteriophora, strain Az148. The graph shows the size distribution and concentration of EVs. The analysis was performed using a NanoSight NS300 with NTA software version 3.2 and a blue 488 nm laser. The sample was measured at 24.7 °C with a camera level of 9, gain of 15, and a syringe pump speed of 15.
Figure 3
Figure 3
Fly survival response to entomopathogenic nematode EVs. D. melanogaster Oregon-R adult flies were injected in the thorax with phosphate-buffered saline (PBS), homogenized H. bacteriophora (HB-DEAD), H. bacteriophora excreted–secreted products (HB-ESP), and H. bacteriophora EVs (HB-EV). Fly survival was monitored up to 8 days following injection. Fly experiments were repeated three times with 60 D. melanogaster adults (5–10 days old) per experimental treatment. The asterisk indicates a value that is significantly different (Mantel–Cox, df = 1, * p < 0.05). Error bars denote standard errors.
Figure 4
Figure 4
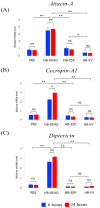
Transcriptional expression of immune deficiency (Imd) pathway genes. D. melanogaster Oregon-R adult flies were intrathoracically injected with phosphate-buffered saline (PBS), H. bacteriophora axenic homogenized nematodes (HB-DEAD), H. bacteriophora excreted–secreted products (HB-ESP), and H. bacteriophora EVs (HB-EV). Expression levels of (A) Attacin, (B) Cecropin, and (C) Diptericin were assessed at 6 and 24 h after injection. Levels of mRNA are presented as the relative abundance of transcripts normalized to RpL32 and are expressed as a ratio compared to flies injected with PBS alone (negative controls). Values are the means from three independent experiments, and error bars are standard deviations. Asterisks (*) indicate a value that is significantly different (one-way ANOVA with a Tukey post hoc test for multiple comparisons). **, p < 0.01; *, p < 0.05; ns, non-significant differences. Red stars (★, p < 0.05) indicate significantly lower gene expression in HB-EV treatments compared to the PBS control. Comparison between relative gene expression at 6 and 24 h was performed with a t-test.
Figure 5
Figure 5
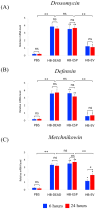
Transcriptional expression of Toll pathway genes. D. melanogaster Oregon-R adult flies were intrathoracically injected with phosphate-buffered saline (PBS), H. bacteriophora axenic homogenized nematodes (HB-DEAD), H. bacteriophora excreted–secreted products (HB-ESP), and H. bacteriophora EVs (HB-EV). Expression levels of (A) Drosomycin, (B) Defensin, and (C) Metchnikowin were assessed at 6 and 24 h after injection. Levels of mRNA are presented as the relative abundance of transcripts normalized to RpL32. Values are the means from three independent experiments, and error bars are standard deviations. Asterisks indicate a value that is significantly different (one-way ANOVA with a Tukey post hoc test for multiple comparisons). **, p < 0.01; *, p < 0.05; ns, non-significant differences. Black stars (★★, p < 0.01; ★, p < 0.05) indicate significantly higher gene expression in either HB-ESP or HB-EV treatments compared to the PBS control. Comparison between relative gene expression at 6 and 24 h was performed with a t-test.
Figure 6
Figure 6
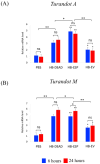
Transcriptional expression of Jak/Stat pathway genes. D. melanogaster Oregon-R adult flies were intrathoracically injected with phosphate-buffered saline (PBS), H. bacteriophora axenic homogenized nematodes (HB-DEAD), H. bacteriophora excreted–secreted products (HB-ESP), and H. bacteriophora EVs (HB-EV). Expression levels of (A) Turandot A and (B) Turandot M were estimated at 6 and 24 h post-injection. Levels of mRNA are shown as the relative abundance of transcripts normalized to RpL32 and are expressed as a ratio compared to flies injected with PBS only (negative controls). Values are the means from three independent experiments, and error bars are standard deviations. Asterisks indicate a value that is significantly different (one-way ANOVA with a Tukey post hoc test for multiple comparisons). **, p < 0.01; *, p < 0.05; ns, non-significant differences. Black stars (★★, p < 0.01; ★, p < 0.05) indicate significantly higher gene expression in either HB-ESP or HB-EV treatments compared to the PBS control. Comparison between relative gene expression at 6 and 24 h was performed with a t-test.
Figure 7
Figure 7
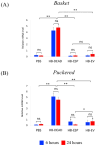
Transcriptional expression of Jnk pathway genes. D. melanogaster Oregon-R adult flies were intrathoracically injected with phosphate-buffered saline (PBS), H. bacteriophora axenic homogenized nematodes (HB-DEAD), H. bacteriophora excreted–secreted products (HB-ESP), and H. bacteriophora EVs (HB-EV). Expression levels of (A) Basket and (B) Puckered were assessed at 6 and 24 h after injection. Levels of mRNA are presented as the relative abundance of transcripts normalized to RpL32. Values are the means from three independent experiments, and error bars are standard deviations. Asterisks indicate a value that is significantly different (one-way ANOVA with a Tukey post hoc test for multiple comparisons). **, p < 0.01; *, p < 0.05; ns, non-significant differences. Black stars (★, p < 0.05) indicate significantly higher gene expression in either HB-ESP or HB-EV treatments compared to the PBS control. Comparison between relative gene expression at 6 and 24 h was performed with a t-test.
Figure 8
Figure 8
Transcriptional expression of TGF-β pathway genes. D. melanogaster Oregon-R adult flies were injected intrathoracically with phosphate-buffered saline (PBS), H. bacteriophora axenic homogenized nematodes (HB-DEAD), H. bacteriophora excreted–secreted products (HB-ESP), and H. bacteriophora EVs (HB-EV). Expression levels of (A) Dawdle, (B) Activin-β (Activin branch), (C) Decapentaplegic, and (D) Glass bottom boat (Bone Morphogenetic Protein branch) were assessed at 6 and 24 h after injection. Levels of mRNA are presented as the relative abundance of transcripts normalized to RpL32. Values are the means from three independent experiments, and error bars are standard deviations. Asterisks indicate a value that is significantly different (one-way ANOVA with a Tukey post hoc test for multiple comparisons). **, p < 0.01; *, p < 0.05; ns, non-significant differences. Black stars (★★, p < 0.01; ★, p < 0.05) indicate significantly higher gene expression in either HB-ESP or HB-EV treatments compared to the PBS control. Comparison between relative gene expression at 6 and 24 h was performed with a t-test.
Figure 9
Figure 9
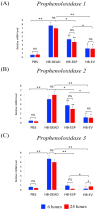
Transcriptional expression of Prophenoloxidase pathway genes. D. melanogaster Oregon-R adult flies were intrathoracically injected with phosphate-buffered saline (PBS), H. bacteriophora axenic homogenized nematodes (HB-DEAD), H. bacteriophora excreted–secreted products (HB-ESP), and H. bacteriophora EVs (HB-EV). Expression levels of (A) Prophenoloxidase 1, (B) Prophenoloxidase 2, and (C) Prophenoloxidase 3 were assessed at 6 and 24 h after injection. Levels of mRNA are presented as the relative abundance of transcripts normalized to RpL32. Values are the means from three independent experiments, and error bars are standard deviations. Asterisks indicate a value that is significantly different (one-way ANOVA with a Tukey post hoc test for multiple comparisons). **, p < 0.01; *, p < 0.05; ns, non-significant differences. Black asterisks (★) indicate significantly increased gene expression in either HB-ESP or HB-EV treatments compared to the PBS control. Black stars (★★, p < 0.01; ★, p < 0.05) indicate significantly higher gene expression in either HB-ESP or HB-EV treatments compared to the PBS control. Red star (★, p < 0.05) indicates significantly lower gene expression in the HB-EV treatment compared to the PBS control. Comparison between relative gene expression at 6 and 24 h was performed with a t-test.
Figure 10
Figure 10
Effect of H. bacteriophora extracellular vesicles (EVs) on the D. melanogaster immune response and survival. Injection of EVs from H. bacteriophora infective juveniles into wild-type adult flies (black arrows) interferes with several innate immune signaling pathways and reduces fly survival.

Similar articles

References

    1. Dillman A.R., Sternberg P.W. Entomopathogenic nematodes. Curr. Biol. 2012;22:R430–R431. doi: 10.1016/j.cub.2012.03.047. - DOI - PMC - PubMed
    1. Dillman A.R., Chaston J.M., Adams B.J., Ciche T.A., Goodrich-Blair H., Stock S.P., Sternberg P.W. An entomopathogenic nematode by any other name. PLoS Pathog. 2012;8:e1002527. doi: 10.1371/journal.ppat.1002527. - DOI - PMC - PubMed
    1. Tarasco E., Fanelli E., Salvemini C., El-Khoury Y., Troccoli A., Vovlas A., De Luca F. Entomopathogenic nematodes and their symbiotic bacteria: From genes to field uses. Front. Insect Sci. 2023;3:1195254. doi: 10.3389/finsc.2023.1195254. - DOI - PMC - PubMed
    1. Parihar R.D., Dhiman U., Bhushan A., Gupta P.K., Gupta P. Heterorhabditis and Photorhabdus Symbiosis: A Natural Mine of Bioactive Compounds. Front. Microbiol. 2022;13:790339. doi: 10.3389/fmicb.2022.790339. - DOI - PMC - PubMed
    1. Ciche T. The biology and genome of Heterorhabditis bacteriophora. WormBook. 2007;13:790339. doi: 10.1895/wormbook.1.135.1. - DOI - PMC - PubMed

MeSH terms

LinkOut - more resources