. 2025 May 30;16(6):674.
doi: 10.3390/genes16060674.

Beyond Transposons: TIGD1 as a Pan-Cancer Biomarker and Immune Modulator

Affiliations

Beyond Transposons: TIGD1 as a Pan-Cancer Biomarker and Immune Modulator

Merve Gulsen Bal Albayrak et al. Genes (Basel). .

Abstract

Background/Objectives: TIGD1 (Trigger Transposable Element Derived 1) is a recently identified oncogene with largely unexplored biological functions. Emerging evidence suggests its involvement in multiple cellular processes across cancer types. This study aimed to perform a comprehensive pan-cancer analysis of TIGD1 to evaluate its expression patterns, diagnostic utility, prognostic value, and association with immunotherapy response and drug resistance. Methods: Transcriptomic and clinical data from TCGA and GTEx were analyzed using various bioinformatic tools. Expression profiling, survival analysis, immune correlation studies, gene set enrichment, single-cell sequencing, and drug sensitivity assessments were performed. Results: TIGD1 was found to be significantly upregulated in various tumor types, with notably high expression in colon adenocarcinoma. Elevated TIGD1 expression was associated with poor prognosis in several cancers. TIGD1 levels correlated with key features of the tumor immune microenvironment, including immune checkpoint gene expression, TMB, and MSI, suggesting a role in modulating anti-tumor immunity. GSEA and single-cell analyses implicated TIGD1 in oncogenic signaling pathways. Furthermore, high TIGD1 expression was linked to resistance to several therapeutic agents, including Zoledronate, Dasatinib, and BLU-667. Conclusions: TIGD1 may serve as a promising diagnostic and prognostic biomarker, particularly in colon, gastric, liver, and lung cancers. Its strong associations with immune modulation and therapy resistance highlight its potential as a novel target for precision oncology and immunotherapeutic intervention.

Keywords: TIGD1; cancer prognosis; drug resistance; immune microenvironment; immunotherapy; microsatellite instability; pan-cancer analysis; tumor mutational burden.


Conflict of interest statement

The authors declare no relevant financial or non-financial conflicts of interest.

Figures

Figure 1
Figure 1
Overview of TIGD1 as a transposable element-derived gene of oncogenic interest. This schematic summarizes TIGD1’s origin from the pogo DNA transposon family, its chromosomal location at 8q24.3 (a region frequently amplified in cancer), and proposed functional roles including gene regulation, alternative splicing, and cell cycle regulation. Despite lacking precise functional characterization, TIGD1 shows expression across various cancers and has not been comprehensively studied in a pan-cancer context. These features suggest its potential involvement in tumor biology, particularly in biomarker discovery and immune modulation.
Figure 2
Figure 2
Pan-cancer TIGD1 mRNA expression. (a) TIGD1 expression across tumor and normal tissues from TCGA and GTEx via TIMER2.0 (* p < 0.05; ** p < 0.01; *** p < 0.001). (b) TIGD1 expression in cancers lacking normal data in TIMER, analyzed via GEPIA (p < 0.001). TPM = transcripts per million. Tumor, normal, and metastasis samples are shown in red, blue, and purple, respectively.
Figure 3
Figure 3
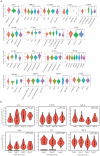
Correlation of TIGD1 expression with tumor subtypes and pathological stages. (a) Violin plots depicting TIGD1 mRNA expression across molecular subtypes of various tumors, as obtained from TISIDB. Expression values are shown as counts per million (CPM). (b) Violin plots illustrating TIGD1 expression across pathological stages (stages I–IV) in adrenocortical carcinoma (ACC), colon adenocarcinoma (COAD), kidney chromophobe carcinoma (KICH), liver hepatocellular carcinoma (LIHC), ovarian serous cystadenocarcinoma (OV), and thyroid carcinoma (THCA). Expression values are represented as Log2(TPM + 1), and statistical significance was assessed using the Kruskal–Wallis test (p < 0.05).
Figure 4
Figure 4
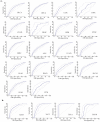
Diagnostic value of TIGD1 in pan-cancer. (a) Receiver operating characteristic (ROC) curves illustrating cancer types where TIGD1 shows moderate diagnostic performance (area under the curve [AUC] between 0.60 and 0.75; p < 0.05). (b) ROC curves for cancer types demonstrating high diagnostic accuracy of TIGD1 (AUC between 0.75 and 1.00; p < 0.05). ROC curves are represented by solid dark blue lines and corresponding 95% confidence intervals (CIs) are shown as light blue dashed lines.
Figure 5
Figure 5
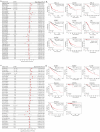
Prognostic value of TIGD1 expression across cancer types. (a) Forest plot of Cox regression analysis for overall survival (OS) in TCGA pan-cancer. (b) Kaplan–Meier OS curves for selected tumor types. (c) Forest plot of Cox regression analysis for disease-free survival (DFS). (d) Kaplan–Meier DFS curves for selected tumor types (p < 0.05). CI = confidence interval. In forest plots, lines crossing the null indicate no significance; lines to the right suggest risk, and to the left, protection.
Figure 6
Figure 6
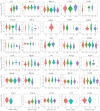
TIGD1 expression across immune subtypes in pan-cancer. Expression levels (CPM) are shown by immune subtype: C1 (wound healing), C2 (IFN-γ dominant), C3 (inflammatory), C4 (lymphocyte depleted), C5 (immunologically quiet), and C6 (TGF-β dominant). Statistical significance was assessed using the Kruskal–Wallis test (p < 0.05). Cancer abbreviations are listed in the “Abbreviation List” section.
Figure 7
Figure 7
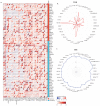
Relationship between TIGD1 expression and immune-associated features. (a) Correlation of TIGD1 expression with 22 immune cell types based on CIBERSORT analysis; red indicates positive and blue indicates negative correlations. (b) Correlation with immune score, (c) stromal score, and (d) estimate score. Significance: * p < 0.05; ** p < 0.01; *** p < 0.001; **** p < 0.0001.
Figure 8
Figure 8
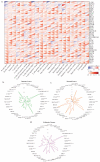
Correlation of TIGD1 expression with (a) immune checkpoint (ICP) genes, (b) tumor mutational burden (TMB), and (c) microsatellite instability (MSI) across cancers. In (a), darker red indicates stronger positive, and darker blue indicates stronger negative correlations. Blue boxes represent stimulatory ICP genes; orange boxes represent inhibitory ones. Significance: * p < 0.05; ** p < 0.01; *** p < 0.001; **** p < 0.0001.
Figure 9
Figure 9
Gene set enrichment analysis (GSEA) of TIGD1 expression in selected cancer types. GSEA was performed to identify biological pathways associated with TIGD1 expression in liver hepatocellular carcinoma (LIHC), colorectal cancer (COADREAD), glioblastoma multiforme (GBM), the combined glioblastoma and lower-grade glioma cohort (GBMLGG), testicular germ cell tumors (TGCT), and thymoma (THYM). The top 10 terms identified by weighted set cover are listed for each cancer. Blue boxes indicate positive correlations, while orange boxes indicate negative correlations. Statistical significance is represented by an FDR ≤ 0.05, highlighted with bright colors.
Figure 10
Figure 10
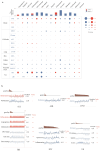
Expression patterns of TIGD1 in single cells and correlation with the functional condition of the tumor from the CancerSEA database (a). A heat map illustrating the relationship between the TIGD1 expression and functional status of various cancers (b). Statistically significant correlations between TIGD1 expression and specific functional states—including proliferation, inflammation, DNA damage, DNA repair, differentiation, and angiogenesis—in acute lymphoblastic leukemia (ALL), acute myeloid leukemia (AML), lung adenocarcinoma (LUAD), retinoblastoma (RB), renal cell carcinoma (RCC), and uveal melanoma (UM) (* p < 0.05; ** p < 0.01; *** p < 0.001).
Figure 11
Figure 11
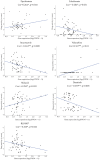
The correlation of TIGD1 expression and sensitivity of FDA-approved drugs in scatter plots (* p < 0.05; ** p < 0.01). A positive correlation is indicated by a correlation coefficient (r) > 0, with statistical significance defined by a threshold of p < 0.05. The x-axis displays RNA-Seq composite gene expression levels [log2(FPKM + 1)], where FPKM denotes Fragments Per Kilobase of Exon per Million reads, and the y-axis represents drug activity level (z-score).

Similar articles

References

    1. Loomans-Kropp H.A., Umar A. Cancer Prevention and Screening: The next Step in the Era of Precision Medicine. Npj Precis. Oncol. 2019;3:3. doi: 10.1038/s41698-018-0075-9. - DOI - PMC - PubMed
    1. Zhang Y., Zhang Z. The History and Advances in Cancer Immunotherapy: Understanding the Characteristics of Tumor-Infiltrating Immune Cells and Their Therapeutic Implications. Cell. Mol. Immunol. 2020;17:807–821. doi: 10.1038/s41423-020-0488-6. - DOI - PMC - PubMed
    1. Kazazian H.H., Wong C., Youssoufian H., Scott A.F., Phillips D.G., Antonarakis S.E. Haemophilia A Resulting from de Novo Insertion of L1 Sequences Represents a Novel Mechanism for Mutation in Man. Nature. 1988;332:164–166. doi: 10.1038/332164a0. - DOI - PubMed
    1. Ogino S., Nosho K., Kirkner G.J., Kawasaki T., Chan A.T., Schernhammer E.S., Giovannucci E.L., Fuchs C.S. A Cohort Study of Tumoral LINE-1 Hypomethylation and Prognosis in Colon Cancer. J. Natl. Cancer Inst. 2008;100:1734–1738. doi: 10.1093/jnci/djn359. - DOI - PMC - PubMed
    1. Rodić N., Sharma R., Sharma R., Zampella J., Dai L., Taylor M.S., Hruban R.H., Iacobuzio-Donahue C.A., Maitra A., Torbenson M.S., et al. Long Interspersed Element-1 Protein Expression Is a Hallmark of Many Human Cancers. Am. J. Pathol. 2014;184:1280–1286. doi: 10.1016/j.ajpath.2014.01.007. - DOI - PMC - PubMed

Substances

LinkOut - more resources