. 2025 Jun 14;16(6):708.
doi: 10.3390/genes16060708.

Half the Chromosome It Used to Be: Identifying Cancer Treatments Targeting Aneuploid Losses

Affiliations

Half the Chromosome It Used to Be: Identifying Cancer Treatments Targeting Aneuploid Losses

Andrew O Disharoon et al. Genes (Basel). .

Abstract

Background/objectives: Aneuploidy is near-ubiquitous in cancer and can decrease chemotherapy efficacy while also sensitizing cells to other drugs.

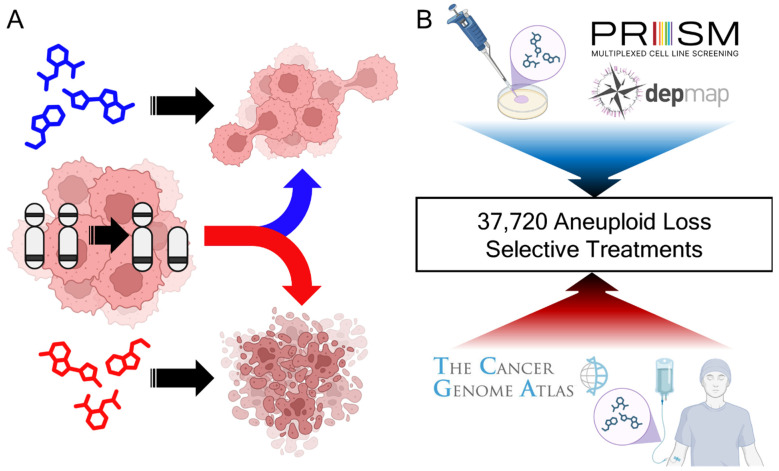
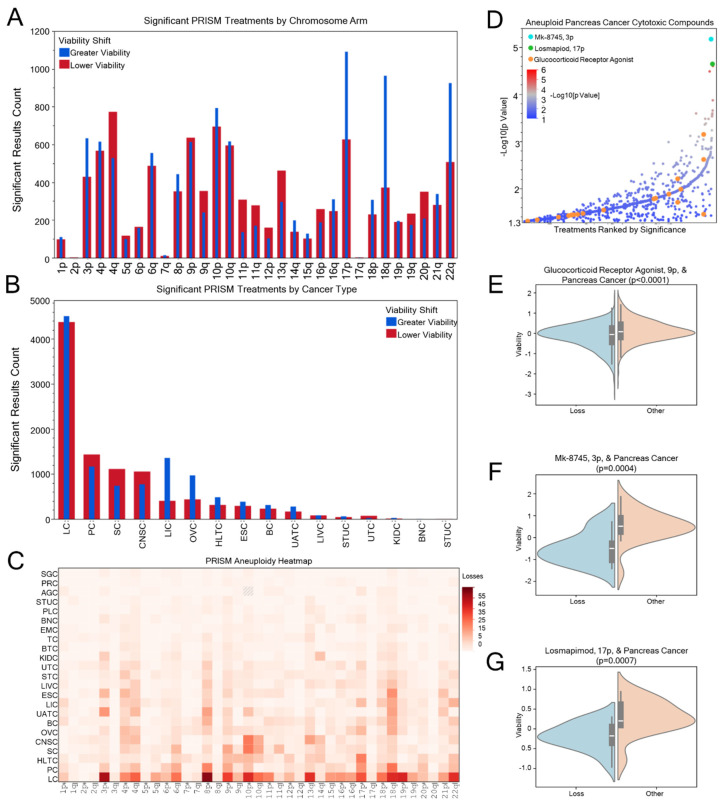
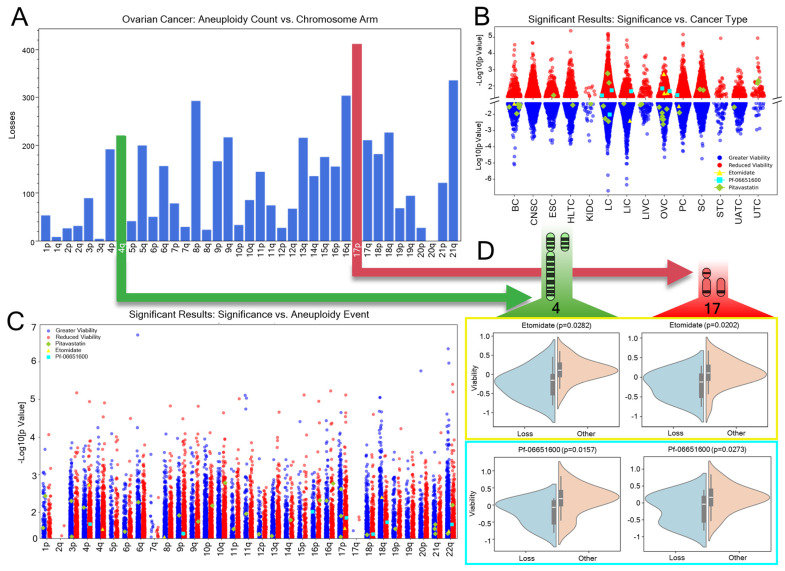
Methods: To systematically identify treatment strategies that target aneuploid cancers, data were integrated from The Cancer Genome Atlas (TCGA; 10,967 samples, 16,948 aneuploidy events) and the Broad Institute's Profiling Relative Inhibition Simultaneously in Mixtures (PRISM) screen of 578 cancer cell lines and 4518 compounds.

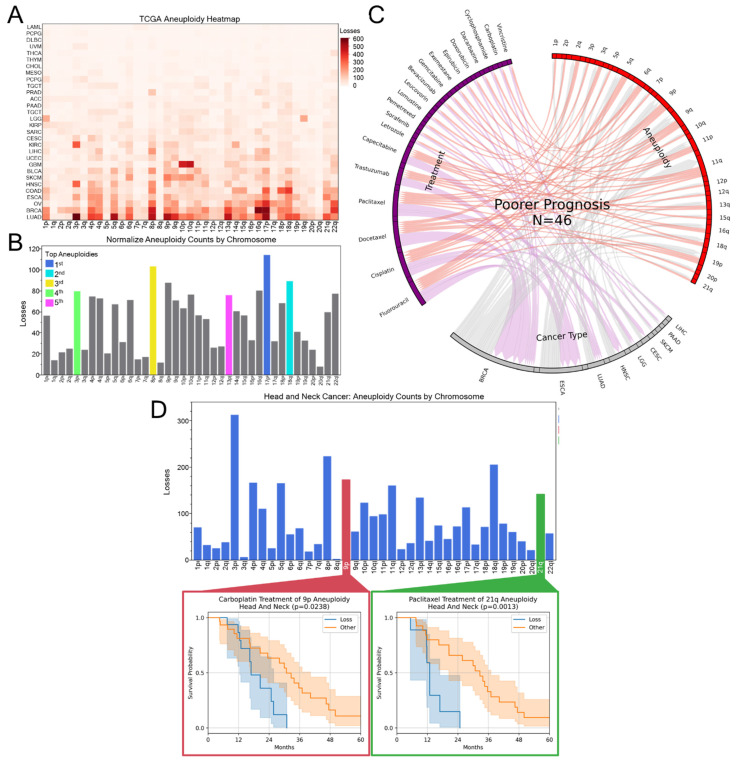
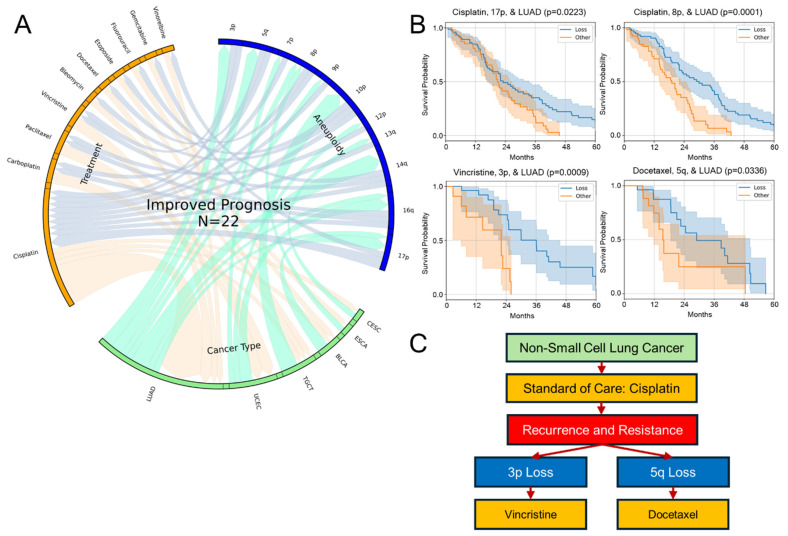
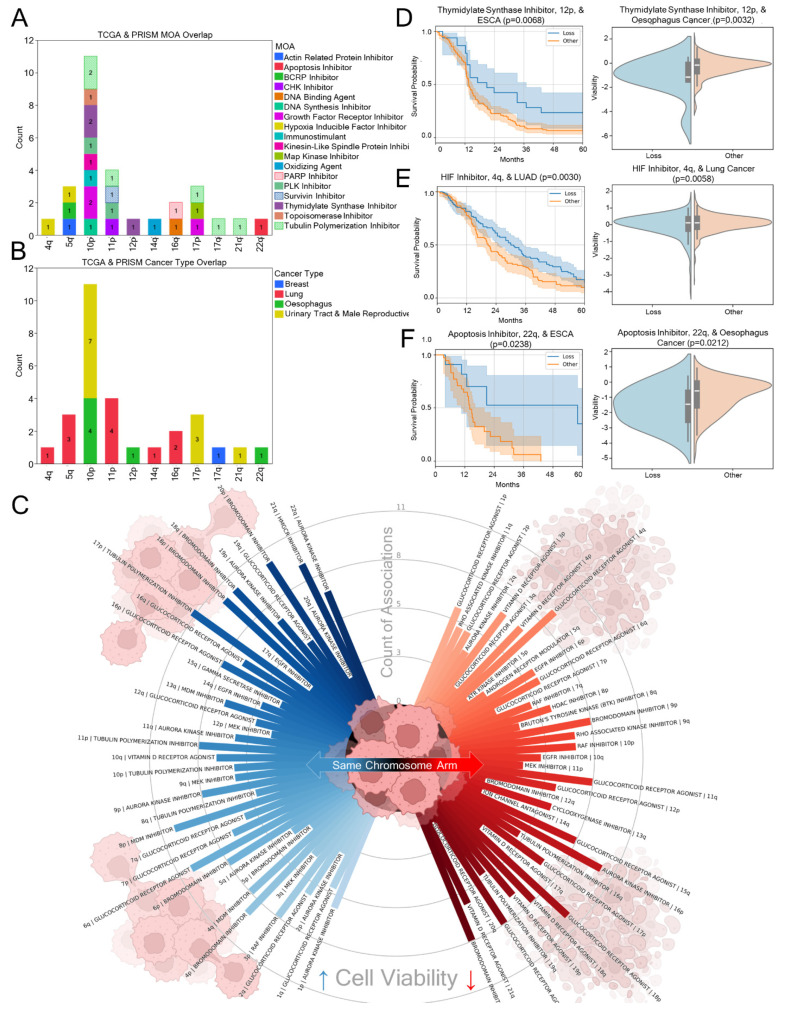
Results: Our analyses uncovered 37,720 significant positive and negative associations linking specific aneuploidies and treatments with patient prognosis or cell viability. Within TCGA data, 22 treatments correlated with improved 5-year survival for specific aneuploid cancers, whereas 46 were linked to worse outcomes. A complementary analysis of PRISM identified 17,946 compound-aneuploidy associations and 16,189 mechanism of action (MOA)-aneuploidy associations. Pathway-altering compounds that selectively reduce viability in cells with aneuploidy profiles were discovered, including an unexpectedly prominent number of glucocorticoid receptor agonists.

Conclusions: This integrated dataset provides a resource for designing therapeutic decision hypotheses, identifying drug-repurposing opportunities, and informing future studies aimed at targeting aneuploidy-induced vulnerabilities in cancer.

Keywords: aneuploidy; cancer; chemotherapy; oncology; precision oncology.


Conflict of interest statement

The authors declare that they have no competing interests. The funders had no role in the design of this study; in the collection, analyses, or interpretation of the data; in the writing of the manuscript; or in the decision to publish the results.

Figures

Figure 1
Figure 1
Extant cancer datasets are rich in aneuploidy-targeting treatment opportunities. (A) Cancer’s lose chromosome arms during their evolution. Aneuploid loss cancers are associated with variable cytotoxicity depending on the treatment; (B) 37,720 significant associations were identified with aneuploid loss, cancer type, treatment (single and aggregated by mechanism of action), and worsened or improved cytotoxicity.
Figure 2
Figure 2
Cancer chromosome arm loss is often associated with poorer prognosis to treatments. (A) The count of TCGA aneuploid loss events by chromosome arm and cancer type. (B) The normalized counts of aneuploid losses, controlling for proportion of cancer types in the TCGA dataset. The first through fifth most common chromosome arm loss events are highlighted as follows: 17p (blue), 8p (yellow), 16q (cyan), 3p (purple), and 13q (violet). (C) Chord diagram showing the connection between treatments, cancer type, and aneuploidy that show worse 5-year prognosis (p < 0.05, N > 10 for both “Loss” and “Other” (not loss) aneuploidy statuses, as calculated by log rank test) in TCGA data as compared to patients without the aneuploid loss. (D) As a case example from Figure 2C., head and neck cancers with 9p aneuploid loss when treated with carboplatin and 21q aneuploid loss when treated with paclitaxel are associated with worse progression-free survival prognosis.
Figure 3
Figure 3
Specific aneuploid losses are associated with improved prognosis to select therapies. (A) Chord diagram showing the connection between treatments, cancer type, and chromosome arm loss shows improved 5-year prognosis (p < 0.05, N > 10 for both “Loss” and “Other” aneuploidy statuses, as calculated by the log rank test) in TCGA data as compared to patients without aneuploidy. (B) Example cases from Figure 3A of progression-free survival differences in patients with 3p and 5q aneuploid loss events in non-small cell lung cancer. (C) Using this information, a possible decision tree amenable to cancer institute retrospective analysis testing is proposed for precision treatment for non-small cell lung cancer based upon the tumor’s cancer aneuploidy.
Figure 4
Figure 4
Mechanism of action study connects tumor drug selectivity to in vitro datasets. (A) The overlap between tumor TCGA data with improved 5-year progression-free survival and Broad PRISM reduced cell line viability data when treated with the same MOA. (B) Quantitation of overlap by cancer type. Note that some cancer types are underrepresented or not assessed due to cell line characterization limitations (see the Methods section). (C) An explosion plot of the all-cancers cell line PRISM data showing the most and least sensitizing MOAs by chromosome arm. The bar length is the count of significantly improved or reduced sensitivity by cancer types in the dataset. Identical chromosome arms are set radially opposed to one another. Blue lines show aneuploid losses which are less sensitive to an MOA, and red lines show those which are greater. (DF) Cross-study comparison showing the progression-free survival (p < 0.05, N > 10 for both “Loss” and “Other” aneuploidy statuses, as calculated by log-rank test) and violin plot (p < 0.05, one-way ANOVA) comparisons between MOA treatment with (E) hypoxia inducible factor (HIF) in lung cancer, (D) thymidylate synthase inhibitors, and (F) apoptosis inhibitors in esophagogastric/oesophagus cancers for the TCGA and Broad PRISM samples.
Figure 5
Figure 5
Identification of potentially novel arm-loss sensitizers, with a pancreatic focus. (A) Counts of significant treatment associations by chromosome arm in the Broad PRISM cell line dataset, with treatments associated with greater viability (less effective at killing cancer cells) shown in blue and lower viability (more effective) in red. (B) Counts of significant treatment associations by cancer type. (C) The count of aneuploid loss events calculated in the Broad PRISM dataset. (D) Significance of treatment associations in pancreatic cancer, with treatments ordered by ascending significance (−Log10[p Value]), with aurora kinase inhibitor Mk-8745 (cyan), MAPK inhibitor losmapimod (green), and glucocorticoid receptor agonists (orange) highlighted. Compounds with multiple significant aneuploidy associations are represented by individual points, with their mean value used to order their X-axis position. (E) Violin plots of glucocorticoid receptor agonist viability in pancreatic cancer cells with 9p aneuploidy, (F) Mk-8745 viability in pancreatic cancer cells with 3p aneuploidy, and (G) losmapimod viability in pancreatic cancer cells with 17p aneuploidy compared to other aneuploidy levels.
Figure 6
Figure 6
Notable arm-selective therapies for the treatment of ovarian cancer. (A) Counts of aneuploid loss from the TCGA dataset among ovarian tumors. 17p (red) and 4q (green) aneuploid loss events are the first and sixth most common events in ovarian cancer. (B) Dot plot of the significant associations between treatment, aneuploidy, and cancer type across the Broad dataset. On the positive Y-axis is the −log10 transformation of p values for treatments with significant cell viability reduction, and the negative Y axis is the log10 transformation of the p values. Red points are significant associations with reduced viability (more effective in cancer toxicity) when treated, and blue dots are those with higher viability (less effective). The treatments WWP2 repressor etomidate (yellow), JAK3 inhibitor Pf-06651600 (cyan), and cholesterol synthesis inhibitor pitavastatin (yellow green) are highlighted. (C) Significant associations by aneuploid loss are plotted with the same point highlighting coloration as (B). (D) Etomidate (yellow box) and Pf-06651600 (cyan box) treatments both significantly reduce cell viability in 17q (red) and 4p (green) chromosome arm loss as compared to other aneuploidy states (p < 0.05, as calculated by ANOVA).

Similar articles

References

    1. Kasperski A. Life Entrapped in a Network of Atavistic Attractors: How to Find a Rescue. Int. J. Mol. Sci. 2022;23:4017. doi: 10.3390/ijms23074017. - DOI - PMC - PubMed
    1. Ben-David U., Amon A. Context is everything: Aneuploidy in cancer. Nat. Rev. Genet. 2020;21:44–62. doi: 10.1038/s41576-019-0171-x. - DOI - PubMed
    1. Simonetti G., Bruno S., Padella A., Tenti E., Martinelli G. Aneuploidy: Cancer strength or vulnerability? Int. J. Cancer. 2019;144:8–25. doi: 10.1002/ijc.31718. - DOI - PMC - PubMed
    1. Weaver B.A.A., Cleveland D.W. Does aneuploidy cause cancer? Curr. Opin. Cell Biol. 2006;18:658–667. doi: 10.1016/j.ceb.2006.10.002. - DOI - PubMed
    1. Sansregret L., Swanton C. The role of aneuploidy in cancer evolution. Cold Spring Harb. Perspect. Med. 2017;7:a028373. doi: 10.1101/cshperspect.a028373. - DOI - PMC - PubMed

Substances

LinkOut - more resources