

Bioinformatics-Driven Identification of Ferroptosis-Related Gene Signatures Distinguishing Active and Latent Tuberculosis
- PMID: 40565608
- PMCID: PMC12192361
- DOI: 10.3390/genes16060716
Bioinformatics-Driven Identification of Ferroptosis-Related Gene Signatures Distinguishing Active and Latent Tuberculosis
Abstract
Background: Tuberculosis (TB) remains a major global public health challenge, and diagnosing it can be difficult due to issues such as distinguishing active TB from latent TB infection (LTBI), as well as the sample collection process, which is often time-consuming and lacks sensitivity and specificity. Ferroptosis is emerging as an important factor in TB pathogenesis; however, its underlying molecular mechanisms are not fully understood. Thus, there is a critical need to establish ferroptosis-related diagnostic biomarkers for tuberculosis (TB).
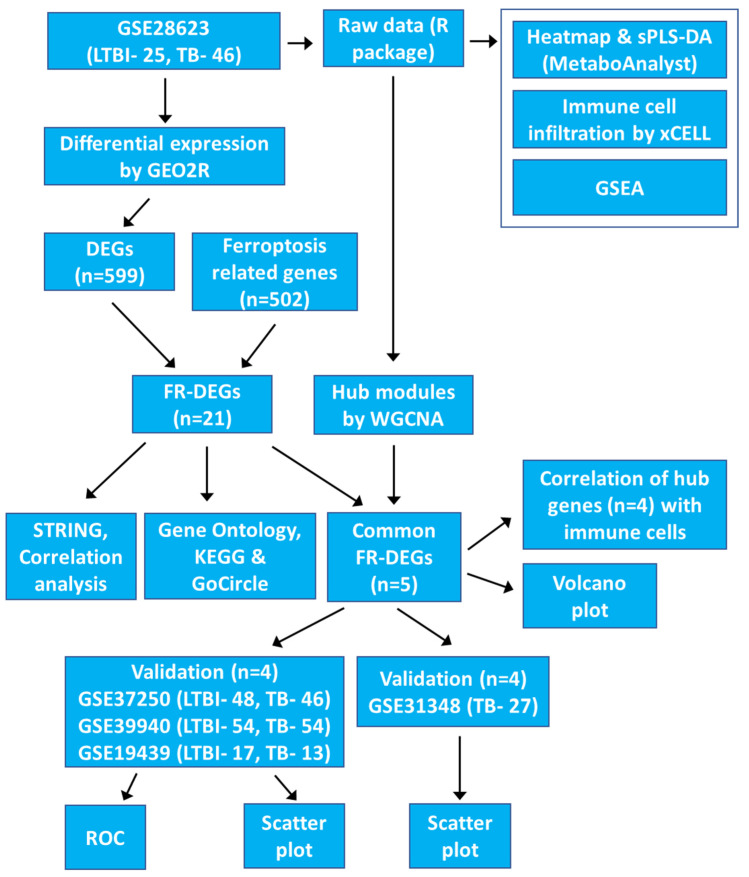
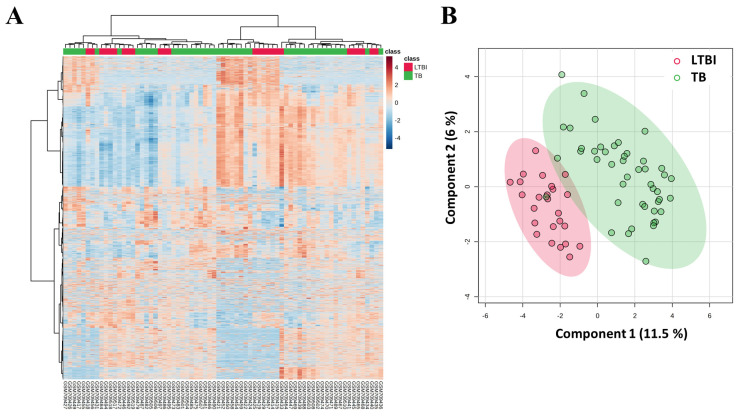
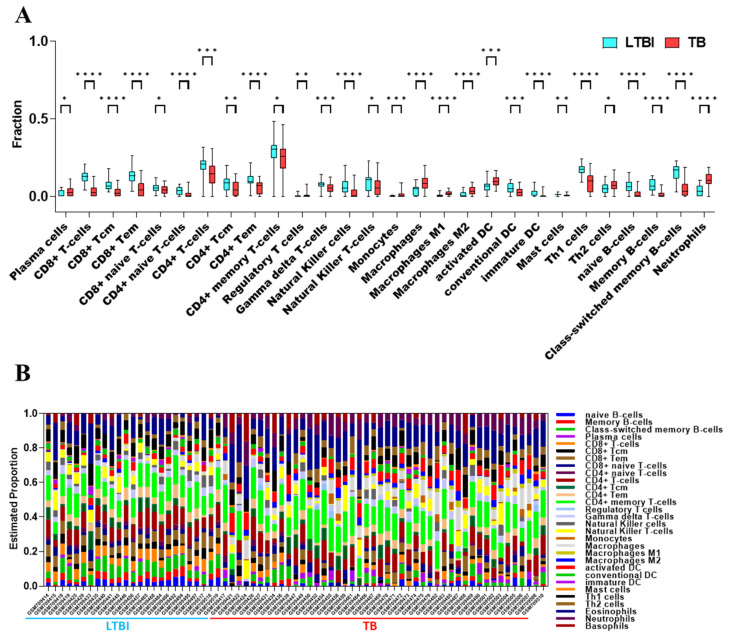
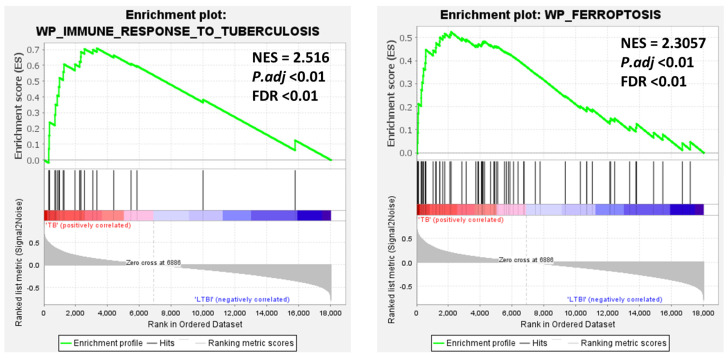
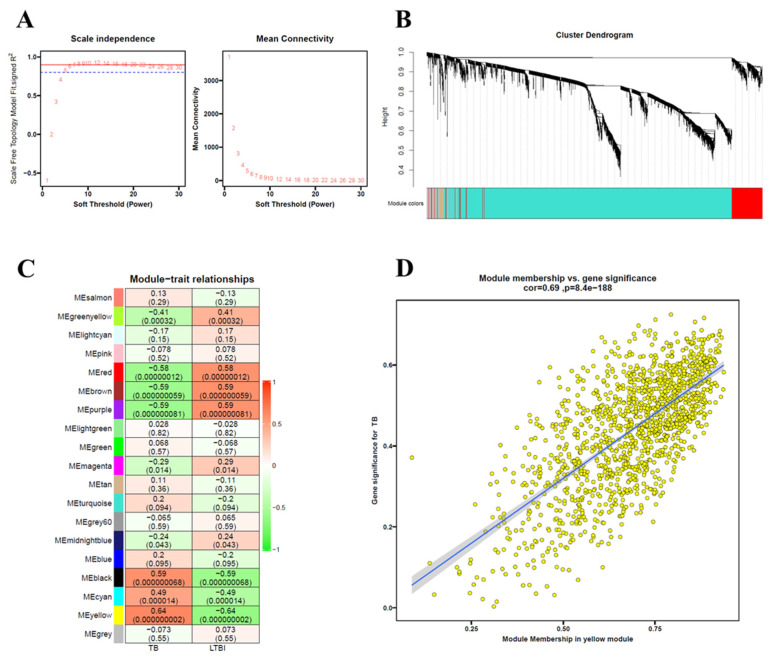
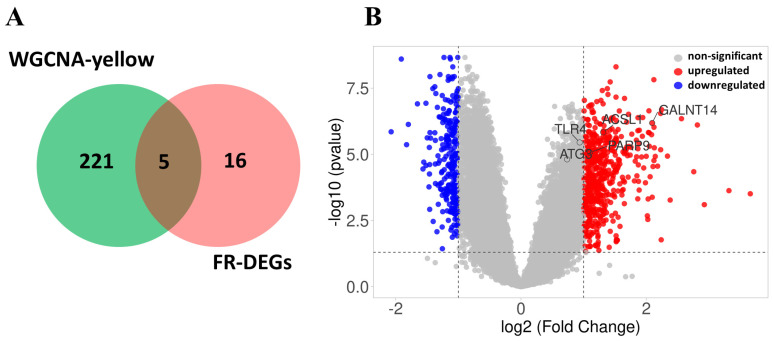
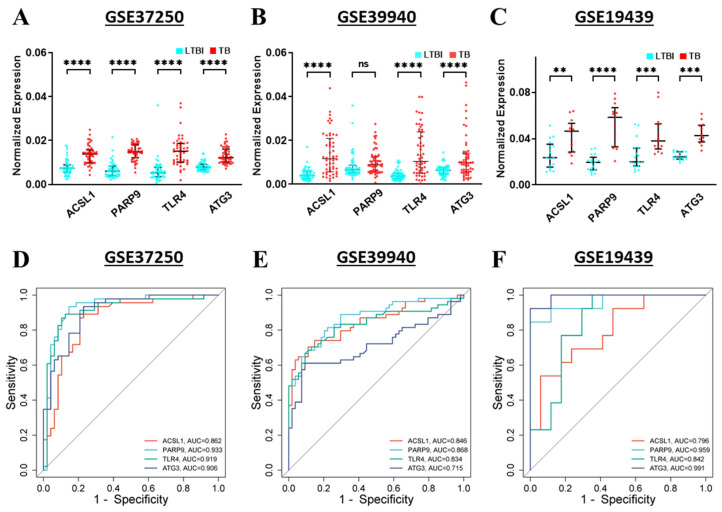
Methods: This study aimed to identify and validate potential ferroptosis-related genes in TB infection while enhancing clinical diagnostic accuracy through bioinformatics-driven gene identification. The microarray expression profile dataset GSE28623 from the Gene Expression Omnibus (GEO) database was used to identify ferroptosis-related differentially expressed genes (FR-DEGs) associated with TB. Subsequently, these genes were used for immune cell infiltration, Gene Set Enrichment Analysis (GSEA), functional enrichment and correlation analyses. Hub genes were identified using Weighted Gene Co-expression Network Analysis (WGCNA) and validated in independent datasets GSE37250, GSE39940, GSE19437, and GSE31348.
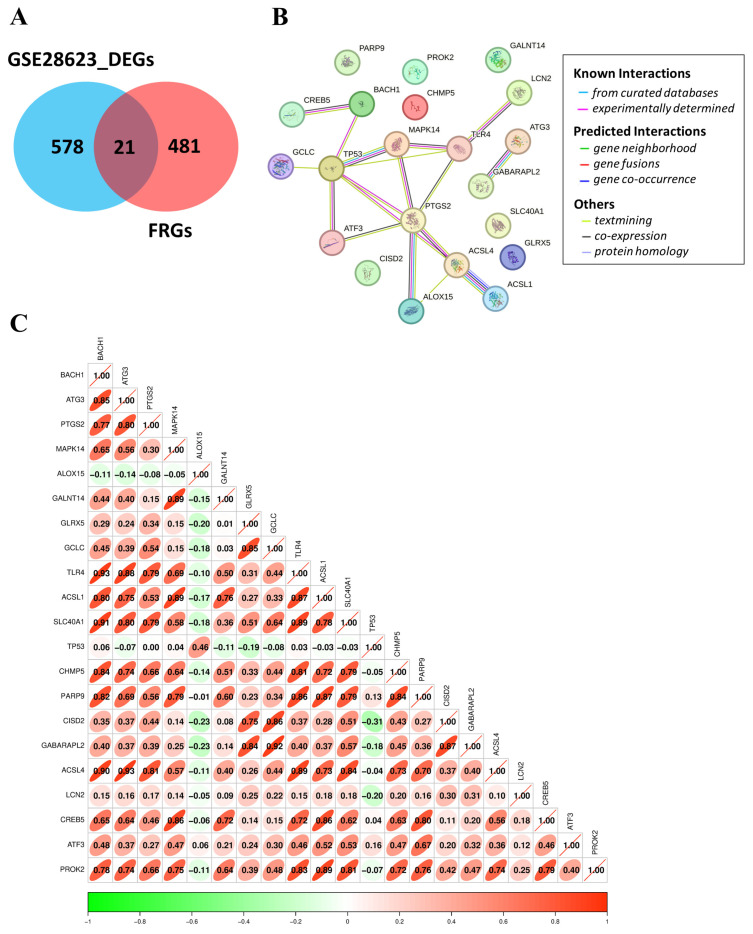
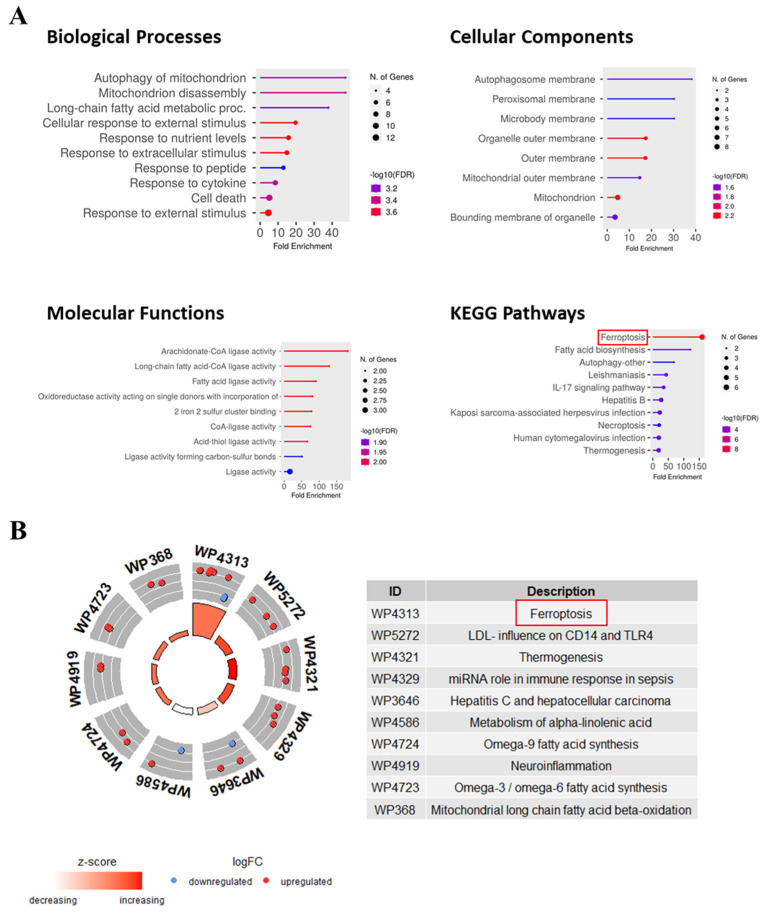
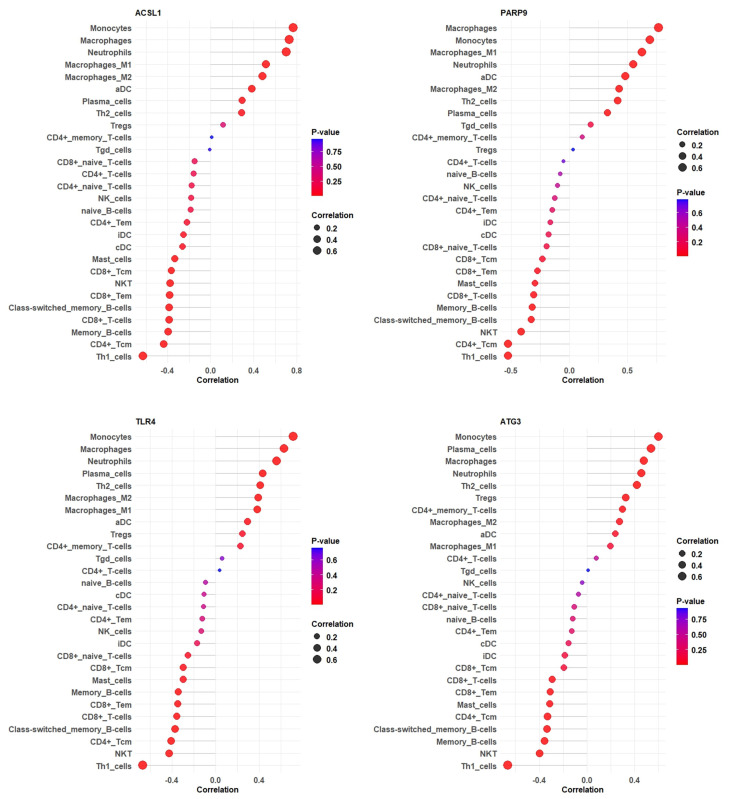
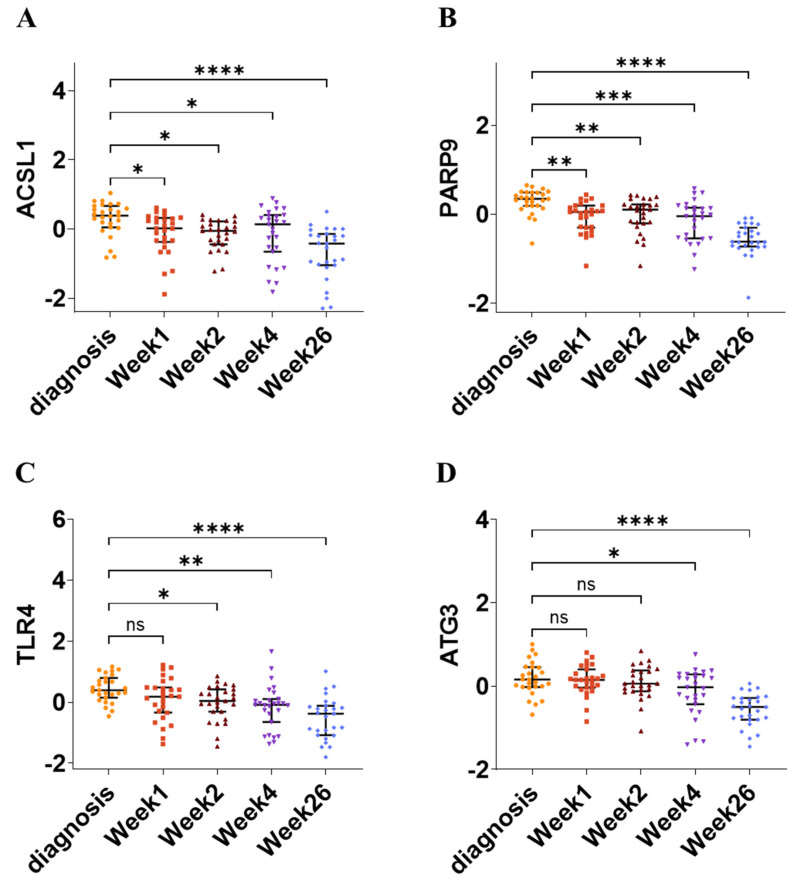
Results: A total of 21 FR-DEGs were identified. Among them, four hub genes (ACSL1, PARP9, TLR4, and ATG3) were identified as diagnostic biomarkers. These biomarkers were enriched in immune-response related pathways and were validated. Immune cell infiltration, GSEA, functional enrichment and correlation analyses revealed that multiple immune cell types could be activated by FR-DEGs. Throughout anti-TB therapy, the expression of the four hub gene signatures significantly decreased in patients cured of TB.
Conclusions: In conclusion, ferroptosis plays a key role in TB pathogenesis. These four hub gene signatures are linked with TB treatment effectiveness and show promise as biomarkers for differentiating TB from LTBI.
Keywords: biomarkers; ferroptosis; gene expression; immune response; tuberculosis.
Conflict of interest statement
The authors declare no conflicts of interest.
Figures
Similar articles
-
Deciphering Shared Gene Signatures and Immune Infiltration Characteristics Between Gestational Diabetes Mellitus and Preeclampsia by Integrated Bioinformatics Analysis and Machine Learning.Reprod Sci. 2025 Jun;32(6):1886-1904. doi: 10.1007/s43032-025-01847-1. Epub 2025 May 15. Reprod Sci. 2025. PMID: 40374866
-
Iron metabolism and preeclampsia: new insights from bioinformatics analysis.J Matern Fetal Neonatal Med. 2025 Dec;38(1):2515416. doi: 10.1080/14767058.2025.2515416. Epub 2025 Jul 1. J Matern Fetal Neonatal Med. 2025. PMID: 40592741
-
Identification of Ferroptosis-related Genes for Diabetic Nephropathy by Bioinformatics and Experimental Validation.Curr Pharm Des. 2025;31(20):1633-1662. doi: 10.2174/0113816128349101250102113613. Curr Pharm Des. 2025. PMID: 39865825
-
A systematic review of rapid diagnostic tests for the detection of tuberculosis infection.Health Technol Assess. 2007 Jan;11(3):1-196. doi: 10.3310/hta11030. Health Technol Assess. 2007. PMID: 17266837
-
Accurate diagnosis of latent tuberculosis in children, people who are immunocompromised or at risk from immunosuppression and recent arrivals from countries with a high incidence of tuberculosis: systematic review and economic evaluation.Health Technol Assess. 2016 May;20(38):1-678. doi: 10.3310/hta20380. Health Technol Assess. 2016. PMID: 27220068 Free PMC article.
References
-
- WHO . Global Tuberculosis Report 2024. World Health Organization; Geneva, Switzerland: 2024.
-
- Turner C.T., Gupta R.K., Tsaliki E., Roe J.K., Mondal P., Nyawo G.R., Palmer Z., Miller R.F., Reeve B.W., Theron G., et al. Blood Transcriptional Biomarkers for Active Pulmonary Tuberculosis in a High-Burden Setting: A Prospective, Observational, Diagnostic Accuracy Study. Lancet Respir. Med. 2020;8:407–419. doi: 10.1016/S2213-2600(19)30469-2. - DOI - PMC - PubMed
-
- Cui Y., Tang Y., Shao M., Zang X., Jiang Y., Cui Z., Dang G., Liu S. Mycobacterium tuberculosis Protease Rv3090 Is Associated with Late Cell Apoptosis and Participates in Organ Injuries and Mycobacterial Dissemination in Mice. Microb. Pathog. 2022;173:105880. doi: 10.1016/j.micpath.2022.105880. - DOI - PubMed
MeSH terms
Substances
LinkOut - more resources
Full Text Sources
Medical
Miscellaneous
