

Genotypic Diversity and Genome-Wide Association Study of Protein Content and Amino Acid Profile in Diverse Potato Accessions
- PMID: 40565648
- PMCID: PMC12192551
- DOI: 10.3390/foods14122039
Genotypic Diversity and Genome-Wide Association Study of Protein Content and Amino Acid Profile in Diverse Potato Accessions
Abstract
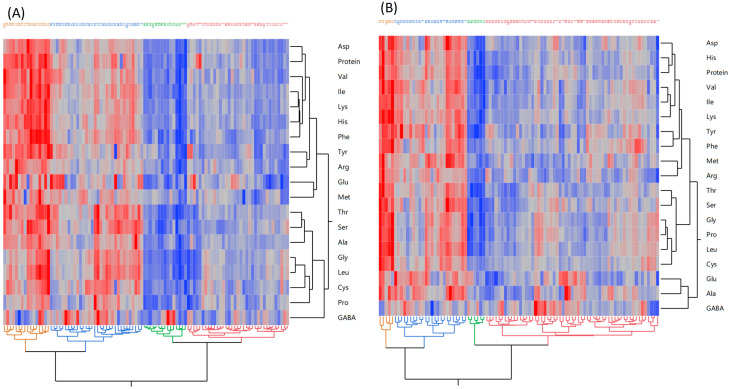
The genotypic diversity and genome-wide association study (GWAS) of potato proteins and amino acid content were investigated in two environments: 98 potato accessions in Environment I and 93 in Environment II. Results revealed that aspartic acid was the most abundant amino acid in environment I and glutamic acid in environment II. The limiting amino acids were cysteine in both environments. The environmental variance accounted for more than 40% of the total variance for all traits except for serine and gamma amino butyric acid (GABA), indicating that potato protein and most amino acids were affected by growing seasons. GWAS identified 78 significant loci associated with potato protein and amino acid contents. The pleiotropic loci, especially those located on chromosomes 6, 9, and 11, provide a strong genetic basis for quality improvement. This study provides genetic insights into potato proteins and amino acid diversity, thereby enhancing molecular breeding for nutritional qualities.
Keywords: amino acid; environment; genotypic diversity; nutritional quality; potato.
Conflict of interest statement
The authors declare no competing financial interests.
Figures


Similar articles
-
Genotypic diversity and genome-wide association study of phosphorus content, amylose content, pasting, and textural properties of potato starch.Carbohydr Polym. 2025 Nov 1;367:123956. doi: 10.1016/j.carbpol.2025.123956. Epub 2025 Jun 25. Carbohydr Polym. 2025. PMID: 40817514
-
Comparative Analysis of Microbial Community Diversity and Dynamics on Diseased Tubers During Potato Storage in Different Regions of Qinghai China.Front Genet. 2022 Feb 22;13:818940. doi: 10.3389/fgene.2022.818940. eCollection 2022. Front Genet. 2022. PMID: 35273638 Free PMC article.
-
Surveillance for Violent Deaths - National Violent Death Reporting System, 50 States, the District of Columbia, and Puerto Rico, 2022.MMWR Surveill Summ. 2025 Jun 12;74(5):1-42. doi: 10.15585/mmwr.ss7405a1. MMWR Surveill Summ. 2025. PMID: 40493548 Free PMC article.
-
Impact of residual disease as a prognostic factor for survival in women with advanced epithelial ovarian cancer after primary surgery.Cochrane Database Syst Rev. 2022 Sep 26;9(9):CD015048. doi: 10.1002/14651858.CD015048.pub2. Cochrane Database Syst Rev. 2022. PMID: 36161421 Free PMC article.
-
Adefovir dipivoxil and pegylated interferon alfa-2a for the treatment of chronic hepatitis B: a systematic review and economic evaluation.Health Technol Assess. 2006 Aug;10(28):iii-iv, xi-xiv, 1-183. doi: 10.3310/hta10280. Health Technol Assess. 2006. PMID: 16904047
References
-
- Ahmad D., Ying Y., Bao J. Understanding starch biosynthesis in potatoes for metabolic engineering to improve starch quality: A detailed review. Carbohydr. Polym. 2024;346:122592. - PubMed
-
- Andre C.M., Oufir M., Hoffmann L., Hausman J.-F., Rogez H., Larondelle Y., Evers D. Influence of environment and genotype on polyphenol compounds and in vitro antioxidant capacity of native Andean potatoes (Solanum tuberosum L.) J. Food Compos. Anal. 2009;22:517–524.
Grants and funding
LinkOut - more resources
Full Text Sources
