

Anti-Diabetic Effect of Soy-Whey Dual-Protein on Mice with Type 2 Diabetes Mellitus Through INS/IRS1/PI3K Signaling Pathway
- PMID: 40565724
- PMCID: PMC12192230
- DOI: 10.3390/foods14122115
Anti-Diabetic Effect of Soy-Whey Dual-Protein on Mice with Type 2 Diabetes Mellitus Through INS/IRS1/PI3K Signaling Pathway
Abstract
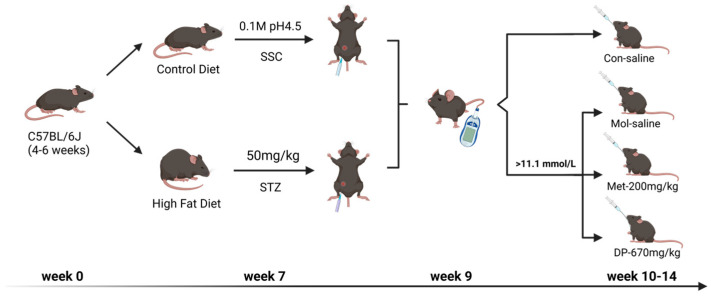
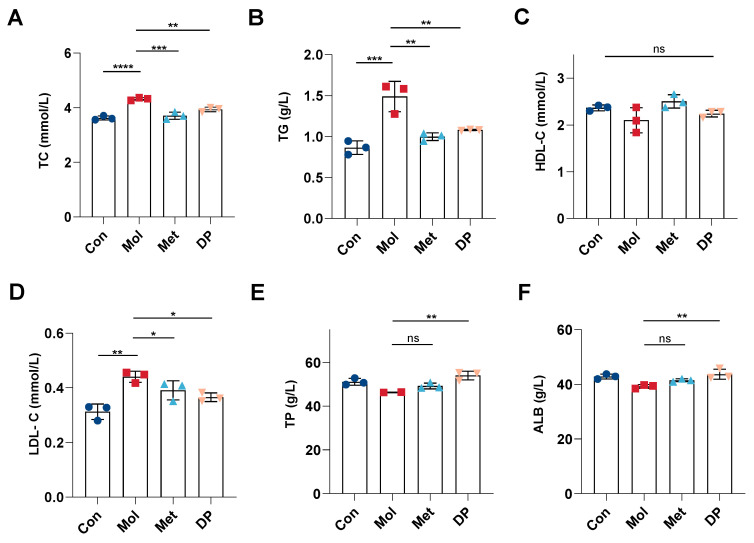
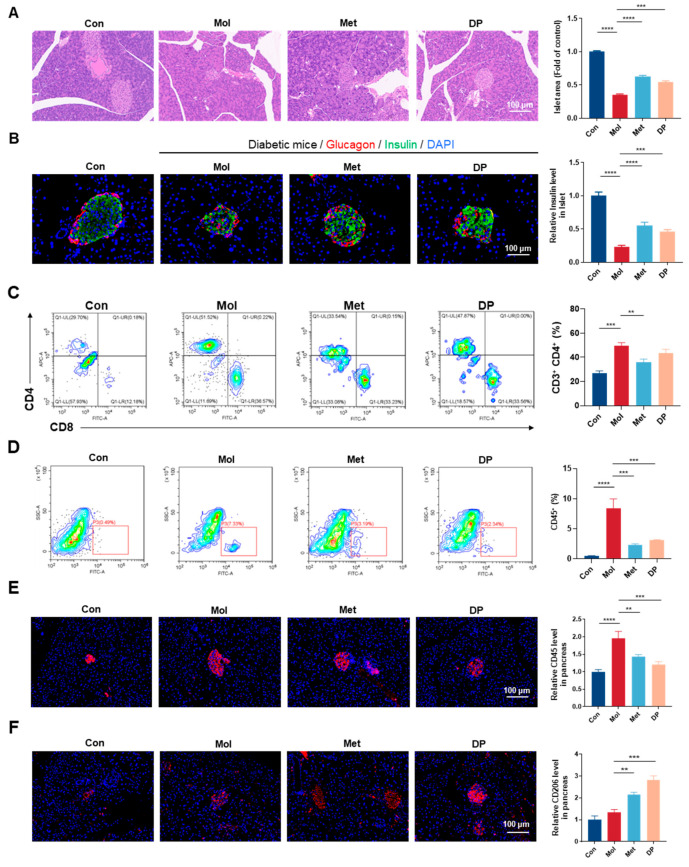
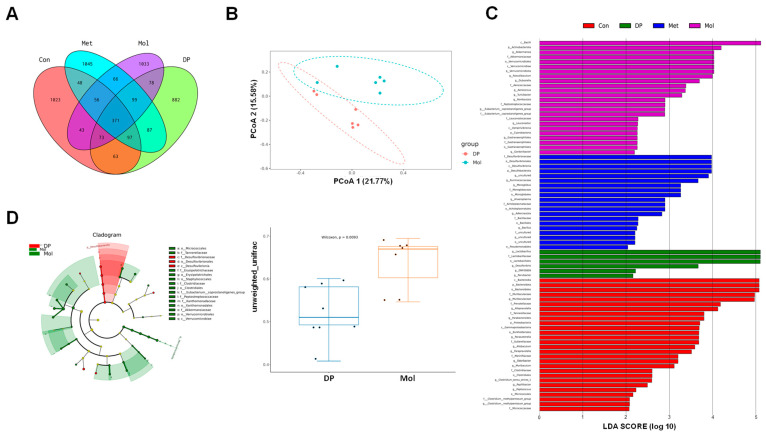
The effects of soy protein and whey protein supplementation on glycemic control show inconsistency, and the mechanisms underlying the impact of a high-protein diet on blood glucose regulation remain unclear. This study aimed to explore the impact of a dual-protein (DP) blend comprising soy protein isolate (SPI) and whey protein concentrate (WPC), processed through high-pressure homogenization, on mice with Type 2 diabetes mellitus (T2DM) and its potential mechanisms. In the in vitro experiments, an insulin-resistant (IR) HepG2 cell model was treated with DP, resulting in a significant enhancement of glucose uptake and upregulation of IRS1 and GLUT4 expression. For the in vivo experiments, male C57BL/6J mice were randomly assigned into four groups (n = 6) based on body weight: normal control, T2DM model group, Metformin-treated group, and DP-treated group. Following a 5-week feeding period, Metformin and DP significantly reduced levels of blood sugar, AUC, TC, TG, and LDL-C in T2DM mice. Additionally, TP and ALB levels in the DP group were notably higher in the model group. In the liver and pancreas, DP alleviated histopathological changes and promoted liver glycogen synthesis in T2DM mice. Moreover, the levels of IRS1 and PI3K in the livers of mice in the DP group were significantly higher than those in the model group. Compared with the model groups, DP significantly reduced the expression of CD45 and increased the expression of CD206 in the pancreas of mice. Furthermore, 16S rRNA analysis revealed that DP altered the composition of the gut microbiota in diabetic mice, increasing the relative abundance of Lactobacillus, Parvibacter, and Lactobacillaceae. This suggested that DP could alleviate functional metabolic disorders in the gut and potentially reverse the risk of related complications. In conclusion, soy whey dual-protein may have an effective nutritional therapeutic effect on T2DM mice by regulating lipid metabolism, the INS/IRS1/PI3K signaling pathway, and gut microbiota.
Keywords: dual-protein; gut microbiota; insulin resistance; mechanism of action; type 2 diabetes.
Conflict of interest statement
The authors declare that the research was conducted in the absence of any commercial or financial relationships that could be construed as a potential conflict of interest.
Figures


Similar articles
-
Antidiabetic effects of Morus alba fruit polysaccharides on high-fat diet- and streptozotocin-induced type 2 diabetes in rats.J Ethnopharmacol. 2017 Mar 6;199:119-127. doi: 10.1016/j.jep.2017.02.003. Epub 2017 Feb 2. J Ethnopharmacol. 2017. PMID: 28163112
-
Aerobic exercise alleviates cognitive impairment in T2DM mice through gut microbiota.Sci Rep. 2025 Jul 4;15(1):23917. doi: 10.1038/s41598-025-07220-1. Sci Rep. 2025. PMID: 40615512 Free PMC article.
-
[Evaluation of the combined effect of Arthrospira platensis biomass phycyanin concentrate and soy protein on male Wistar rats fed a high-fat diet with added cholesterol].Vopr Pitan. 2025;94(2):73-84. doi: 10.33029/0042-8833-2025-94-2-73-84. Epub 2025 Mar 19. Vopr Pitan. 2025. PMID: 40418136 Russian.
-
The Effect of Adding Protein to a Carbohydrate Meal on Postprandial Glucose and Insulin Responses: A Systematic Review and Meta-Analysis of Acute Controlled Feeding Trials.J Nutr. 2024 Sep;154(9):2640-2654. doi: 10.1016/j.tjnut.2024.07.011. Epub 2024 Jul 15. J Nutr. 2024. PMID: 39019167
-
Insulin secretagogues for prevention or delay of type 2 diabetes mellitus and its associated complications in persons at increased risk for the development of type 2 diabetes mellitus.Cochrane Database Syst Rev. 2016 Oct 17;10(10):CD012151. doi: 10.1002/14651858.CD012151.pub2. Cochrane Database Syst Rev. 2016. PMID: 27749986 Free PMC article.
References
-
- Dennis J.M., Henley W.E., Weedon M.N., Lonergan M., Rodgers L.R., Jones A.G., Hamilton W.T., Sattar N., Janmohamed S., Holman R.R., et al. Sex and BMI Alter the Benefits and Risks of Sulfonylureas and Thiazolidinediones in Type 2 Diabetes: A Framework for Evaluating Stratification Using Routine Clinical and Individual Trial Data. Diabetes Care. 2018;41:1844–1853. doi: 10.2337/dc18-0344. - DOI - PMC - PubMed
Grants and funding
LinkOut - more resources
Full Text Sources
Research Materials
Miscellaneous
