Review
. 2025 Jun 10;14(12):4112.
doi: 10.3390/jcm14124112.

Impact of Ectopic Pregnancy on the Outcomes of the Subsequent Pregnancy: A Systematic Review and Meta-Analysis

Affiliations
Review

Impact of Ectopic Pregnancy on the Outcomes of the Subsequent Pregnancy: A Systematic Review and Meta-Analysis

Dimitrios Papageorgiou et al. J Clin Med. .

Abstract

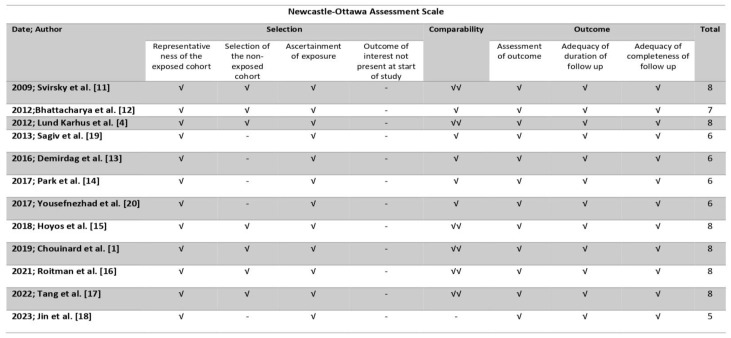
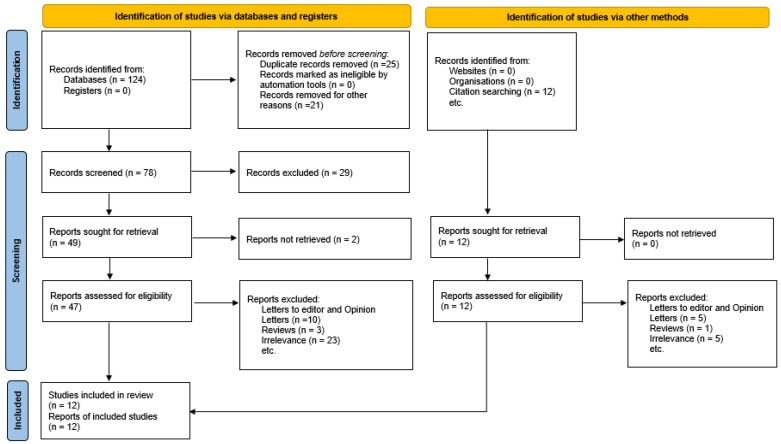
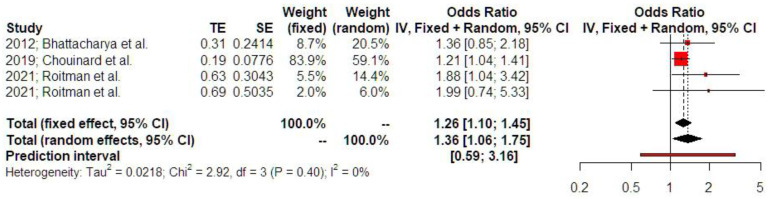
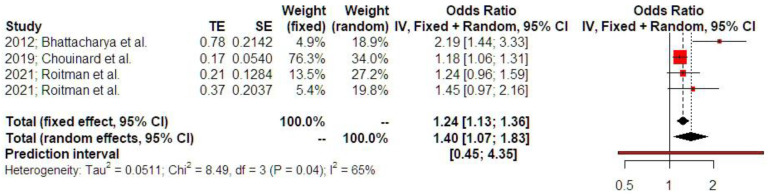
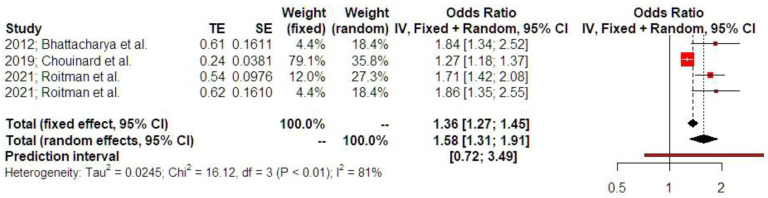
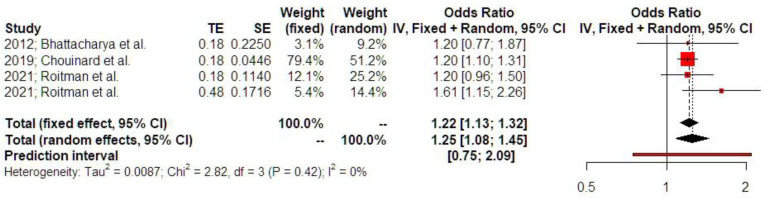
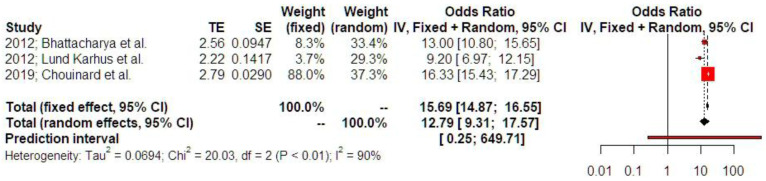
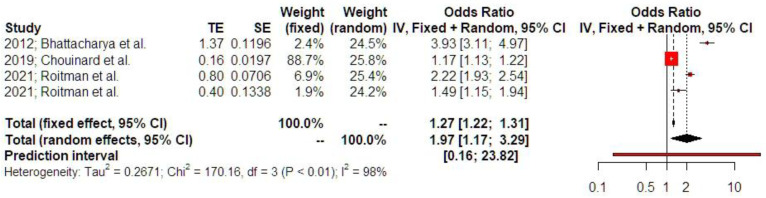
Background/Objectives: Although ectopic pregnancy has been extensively studied in terms of epidemiology, associated risk factors, diagnostic approaches, and treatment modalities, the data regarding its impact on the development of adverse outcomes in subsequent pregnancy remain scarce and conflicting. We aim to evaluate the adverse perinatal outcomes of women with a history of ectopic pregnancy Methods: We used the Medline (1966-2024), Scopus (2004-2024), Clinicaltrials.gov (2008-2024), EMBASE (1980-2024), Cochrane Central Register of Controlled Trials CENTRAL (1999-2024), and Google Scholar (2004-2024) databases in our primary search. All studies that evaluated the impact of prior of ectopic pregnancy on the perinatal outcomes of the subsequent pregnancy and reported rates of adverse perinatal outcomes were considered eligible for inclusion. Twelve peer-reviewed papers were considered for inclusion in our study. We enrolled a total of 2,162,731 women. Of those, 23,823 (1.1%) had a history of prior ectopic pregnancy. A total of 4 out of 12 studies provided the necessary data to be included in the metanalysis. Results: Women with a history of treated ectopic pregnancy, either medically or surgically, demonstrated increased risk of developing placental abruption, hypertensive disorders of pregnancy, and preterm birth. History of ectopic pregnancy was also positively associated with low birth weight, subsequent ectopic pregnancy, and increased risk of a subsequent emergency cesarean section. Conclusions: The meta-analysis reveals evidence that ectopic pregnancy is positively associated with adverse perinatal outcomes in subsequent pregnancy. Our findings should be considered preliminary and serve as a basis for future research as the retrieved data are scarce and cannot be deemed sufficient.

Keywords: ectopic pregnancy; emergency cesarean section; gestational hypertension; low birth weight; methotrexate; placental abruption; preterm delivery; salpingectomy; salpingostomy; tubal pregnancy.


Conflict of interest statement

The authors declare no conflicts of interest.

Figures

Figure 2
Figure 2
Newcastle–Ottawa Scale (NOS) quality assessment of the included studies. √: The selected quality item was evaluated and found present in the study (selection and outcome categories). √: The study groups were controlled for one important factor (comparability category). √√: The study groups were controlled for two important factors (comparability category) [1,4,11,12,13,14,15,16,17,18,19,20].
Figure 1
Figure 1
Flowchart of search strategy.
Figure 3
Figure 3
Odds ratio of placental abruption. The vertical line represents the “no difference” point between the two groups. Red squares represent the odds ratios of the included studies; horizontal black lines indicate the 95% confidence intervals of the included studies; diamond represents pooled odds ratios obtained from the meta-analysis outcomes, together with a 95% confidence interval for all studies; the horizontal red line represents prediction intervals. The weight of the included research is illustrated separately for fixed and random effects models. No statistical heterogeneity is noted for placental abruption (I2 = 0%) [1,12,16].
Figure 4
Figure 4
Odds ratio of hypertensive disorders of pregnancy. The vertical line represents the “no difference” point between the two groups. Red squares represent the odds ratios of the included studies; horizontal black lines indicate the 95% confidence intervals of the included studies; diamond represents pooled odds ratios obtained from the meta-analysis outcomes, together with a 95% confidence interval for all studies; the horizontal red line represents prediction intervals. The weight of the included research is illustrated separately for fixed and random effects models. Substantial statistical heterogeneity is noted for hypertensive disorders of pregnancy (I2 = 65%) [1,12,16].
Figure 5
Figure 5
Odds ratio of preterm birth. Forest plot analysis: The vertical line represents the “no difference” point between the two groups. Red squares represent the odds ratios of the included studies; horizontal black lines indicate the 95% confidence intervals of the included studies; diamond represents pooled odds ratios obtained from the meta-analysis outcomes, together with a 95% confidence interval for all studies; the horizontal red line represents prediction intervals. The weight of the included research is illustrated separately for fixed and random effects models. High statistical heterogeneity is noted for preterm birth (I2 = 81%) [1,12,16].
Figure 6
Figure 6
Odds ratio of low birth weight. Forest plot analysis: The vertical line represents the “no difference” point between the two groups. Red squares represent the odds ratios of the included studies; horizontal black lines indicate the 95% confidence intervals of the included studies; diamond represents pooled odds ratios obtained from the meta-analysis outcomes, together with a 95% confidence interval for all studies; the horizontal red line represents prediction intervals. The weight of the included research is illustrated separately for fixed and random effects models. No statistical heterogeneity is noted for low birth weight (I2 = 0%) [1,12,16].
Figure 7
Figure 7
Odds ratio of subsequent ectopic pregnancy. The vertical line represents the “no difference” point between the two groups. Red squares represent the odds ratios of the included studies; horizontal black lines indicate the 95% confidence intervals of the included studies; diamond represents pooled odds ratios obtained from the meta-analysis outcomes, together with a 95% confidence interval for all studies; the horizontal red line represents prediction intervals. The weight of the included research is illustrated separately for fixed and random effects models. The weight of included studies is depicted for fixed and random effects model separately. High statistical heterogeneity is noted for subsequent ectopic pregnancy (I2 = 90%) [1,4,12].
Figure 8
Figure 8
Odds ratio of emergency cesarean section. The vertical line represents the “no difference” point between the two groups. Red squares represent the odds ratios of the included studies; horizontal black lines indicate the 95% confidence intervals of the included studies; diamond represents pooled odds ratios obtained from the meta-analysis outcomes, together with a 95% confidence interval for all studies; the horizontal red line represents prediction intervals. The weight of the included research is illustrated separately for fixed and random effects models. High statistical heterogeneity is noted for emergency cesarean section (I2 = 98%) [1,12,16].

Similar articles

References

    1. Chouinard M., Mayrand M.H., Ayoub A., Healy-Profitós J., Auger N. Ectopic pregnancy and outcomes of future intrauterine pregnancy. Fertil. Steril. 2019;112:112–119. doi: 10.1016/j.fertnstert.2019.03.019. - DOI - PubMed
    1. Zane S.B., Kieke B.A., Jr., Kendrick J.S., Bruce C. Surveillance in a time of changing health care practices: Estimating ectopic pregnancy incidence in the United States. Matern. Child Health J. 2002;6:227–236. doi: 10.1023/A:1021106032198. - DOI - PubMed
    1. Mann L.M., Kreisel K., Llata E., Hong J., Torrone E.A. Trends in ectopic pregnancy diagnoses in United States emergency departments, 2006–2013. Matern. Child Health J. 2020;24:213–221. doi: 10.1007/s10995-019-02842-0. - DOI - PMC - PubMed
    1. Lund Kårhus L., Egerup P., Wessel Skovlund C., Lidegaard Ø. Long-term reproductive outcomes in women whose first pregnancy is ectopic: A national controlled follow-up study. Hum. Reprod. 2013;28:241–246. doi: 10.1093/humrep/des375. - DOI - PubMed
    1. Egerup P., Kårhus L.L., Skovlund C.W., Lidegaard Ø. Improving reproductive long-term prognosis for women with a first ectopic pregnancy. A national controlled follow-up study. Acta Obstet. Gynecol. Scand. 2014;93:490–496. doi: 10.1111/aogs.12377. - DOI - PubMed

LinkOut - more resources