. 2025 Jun 11;14(12):4143.
doi: 10.3390/jcm14124143.

Effects of Neuromuscular Priming with Spinal Cord Transcutaneous Stimulation on Lower Limb Motor Performance in Humans: A Randomized Crossover Sham-Controlled Trial

Affiliations

Effects of Neuromuscular Priming with Spinal Cord Transcutaneous Stimulation on Lower Limb Motor Performance in Humans: A Randomized Crossover Sham-Controlled Trial

Simone Zaccaron et al. J Clin Med. .

Abstract

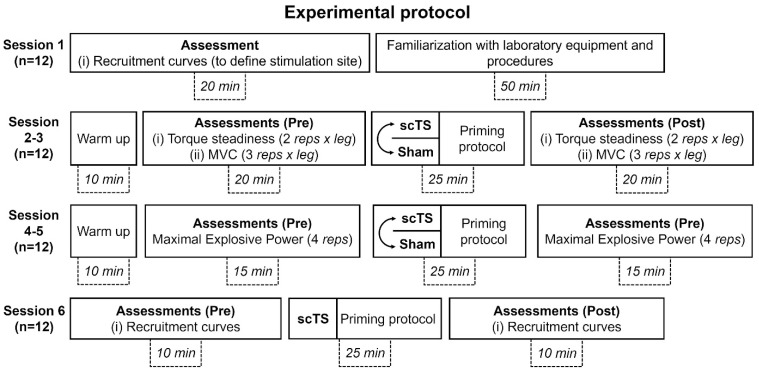
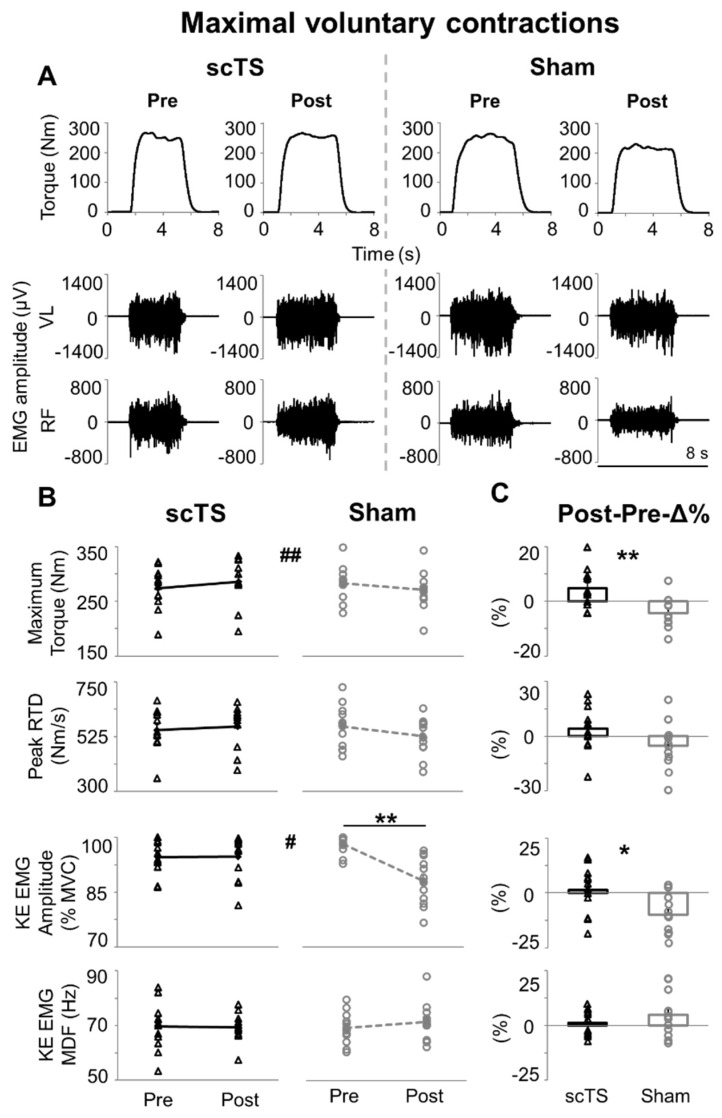
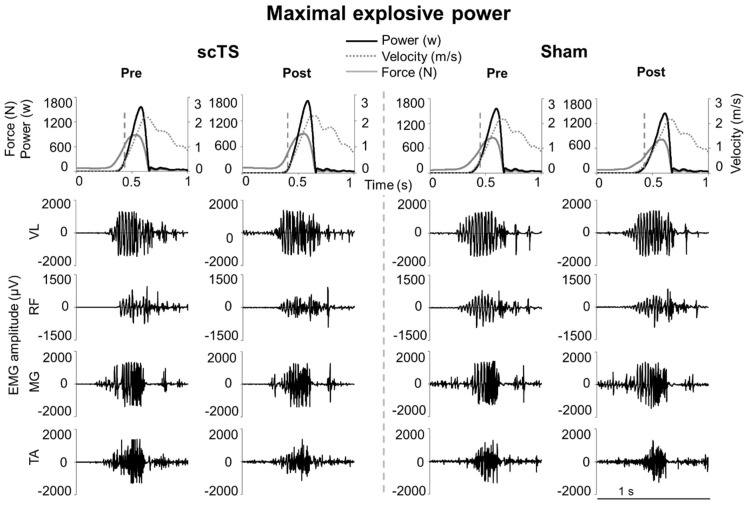
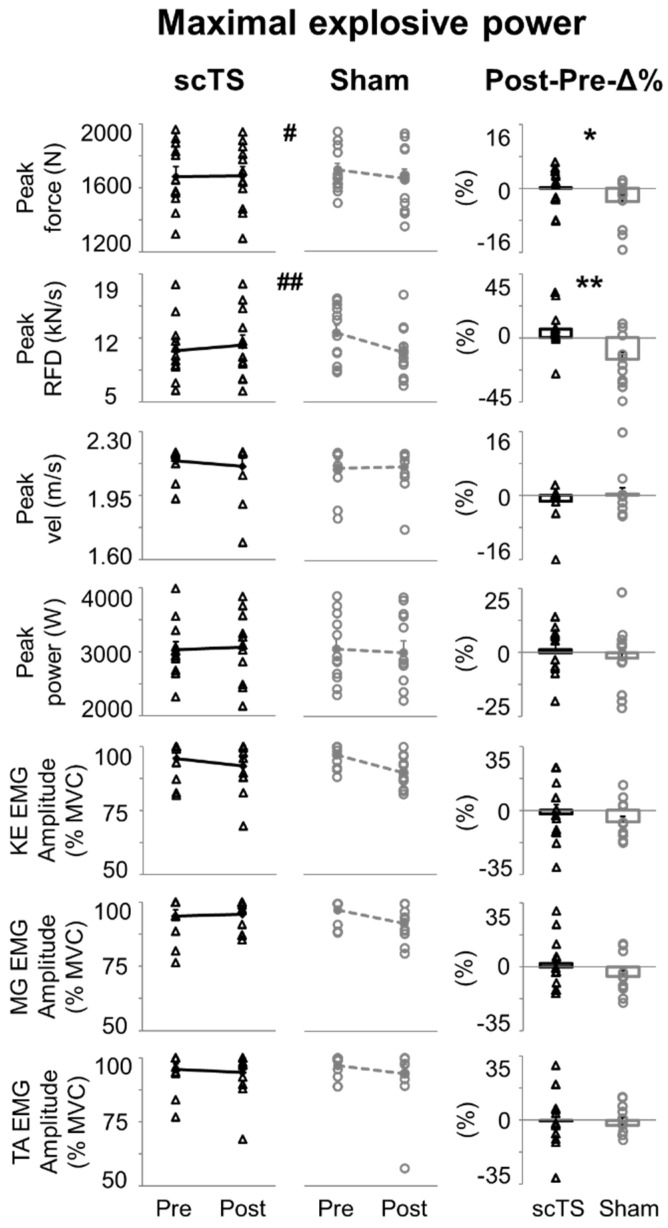
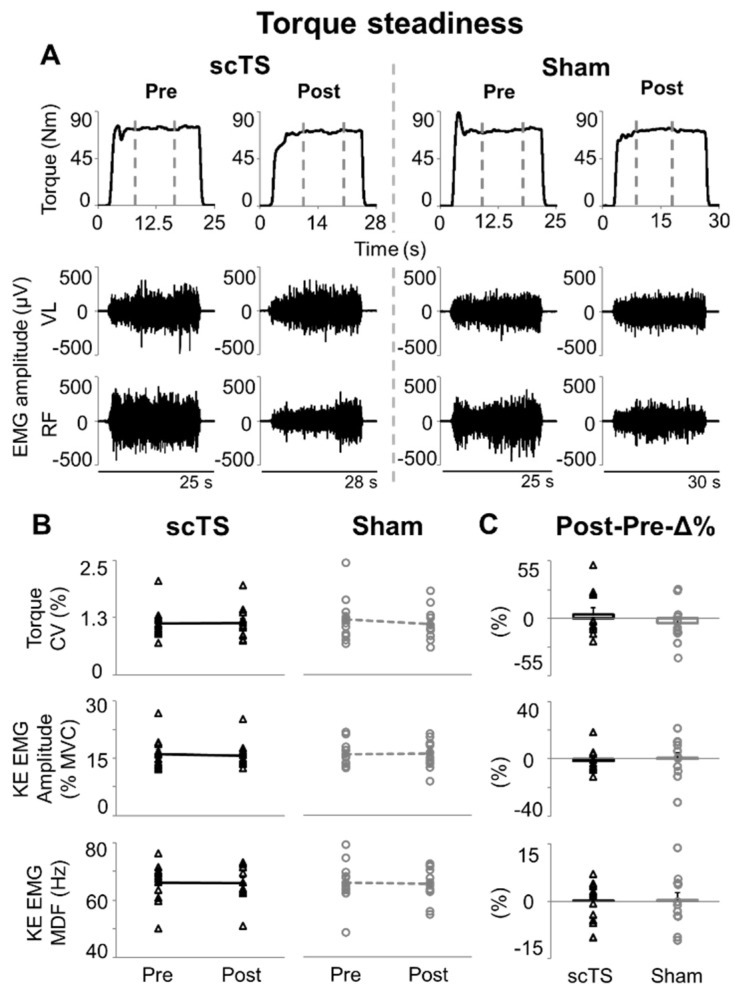
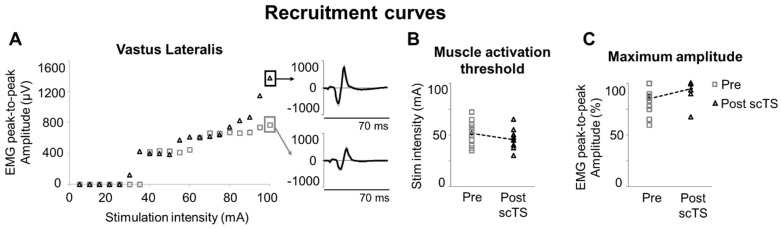
Background: Lower limb motor output contributes to determining functional performance in many motor tasks. This study investigated the effects of non-invasive spinal cord transcutaneous stimulation (scTS) applied during an exercise-based priming protocol on lower limb muscle force and power generation. Methods: Twelve young, physically active male volunteers (age: 22.7 ± 2.1 years) participated in this randomized crossover, sham-controlled study. The maximal voluntary contraction and low-level torque steadiness of knee extensors, as well as the maximal explosive extension of lower limbs, were assessed before and after the priming protocol with scTS or sham stimulation over a total of four experimental sessions. Further, characteristics of evoked potentials to scTS related to spinal circuitry excitability were assessed in the supine position before and after the scTS priming protocol. The exercise component of the ~25 min priming protocol consisted of low-volume, low- and high-intensity lower limb motor tasks. Results: scTS priming protocol tended to increase or maintain maximum isometric torque during knee extension (4.7%) as well as peak force (0.2%) and rate of force development (6.0%) during explosive lower limb extensions, whereas sham priming protocol tended to decrease them (-4.3%, -3.3%, and -15.1%, respectively). This resulted in significant interactions (p = 0.001 to 0.018) and medium-large differences between scTS and sham protocols. These findings were associated with meaningful trends of some neurophysiological variables. Conversely, priming protocols did not affect low-level torque steadiness. Conclusions: scTS counteracted the unexpected fatigue induced by the exercise-based priming protocol, supporting lower limb performance during maximal efforts. Future studies are warranted to assess the implementation of scTS with optimized exercise-based priming protocols during training and rehabilitation programmes that include high-intensity neuromuscular efforts.

Keywords: electromyography; maximal explosive power; maximal voluntary contraction; motor control; neuromodulation.


Conflict of interest statement

Authors have no competing financial interests. The results of the study are presented clearly, honestly, and without fabrication, falsification, or inappropriate data manipulation.

Figures

Figure 1
Figure 1
Experimental protocol. Overview of the six experimental sessions of the study. All subjects enrolled (n = 12) completed the experimental protocol. Testing of scTS or sham priming protocol in Sessions 2–3 and 4–5 was proposed in a randomized order. Approximate duration of the portions of each experimental session (participant’s preparation excluded) is reported in minutes. Reps: number of repetitions performed for the tested motor task. MVC: maximal voluntary contraction; scTS: spinal cord transcutaneous stimulation; Sham: sham stimulation.
Figure 2
Figure 2
Maximal voluntary contractions. (A) Time course of torque output and EMG activity of vastus lateralis (VL) and rectus femoris (RF) during representative maximal voluntary isometric knee extensions generate before (Pre) and after (Post) priming protocol with spinal cord transcutaneous stimulation (scTS) or sham stimulation (Sham). (B) Maximum torque output, peak rate of torque development (RTD), EMG amplitude (quantified by root mean square) and median power frequency (MDF) of knee extensors (KE, average value between VL and RF). Significant Time × Treatment interaction by two-way within-subjects ANOVA: # p < 0.05; ## p < 0.01. ** significant difference by Bonferroni post hoc test, p < 0.01. (C) Post vs. Pre percent difference (Post-Pre-Δ%) assessed within the scTS or sham priming session were statistically compared by paired t-test or Wilcoxon test: * p < 0.05; ** p < 0.01. Results in (B,C) are reported as individual data points (empty black triangles: scTS session; empty grey circles: sham session) as well as mean and standard error. Note that individual data points are superimposed on error bars.
Figure 3
Figure 3
Maximal explosive power. Time course of force, velocity, power, and EMG of vastus lateralis (VL), rectus femoris (RF), medial gastrocnemius (MG), and tibialis anterior (TA) during representative bilateral explosive extensions of the lower limbs performed on the sled ergometer EXER, which was inclined by 20 degrees. Vertical, grey dashed lines in the top row indicate the time point corresponding to the peak rate of force development. These efforts were generated before (Pre) and after (Post) priming protocol with spinal cord transcutaneous stimulation (scTS) or sham stimulation (Sham).
Figure 4
Figure 4
Maximal explosive power of lower limbs. Peak force, rate of force development (RFD), velocity, and power, as well as EMG amplitude (quantified by root mean square) of knee extensors (KE, average value between vastus lateralis and rectus femoris), medial gastrocnemius (MG) and tibialis anterior are reported as individual data points (empty black triangles: scTS session; empty grey circles: Sham session) or mean and standard error. Note that individual data points are superimposed on error bars. scTS: spinal cord transcutaneous stimulation; Sham: sham stimulation; Pre: before neuromuscular priming protocol; Post: after neuromuscular priming protocol; Post-Pre-Δ%: Post vs. Pre percent difference within each session. Significant Time × Treatment interaction by two-way within-subjects ANOVA: # p < 0.05; ## p < 0.01. Post-Pre-Δ% calculated within the scTS or sham priming session were statistically compared by paired t-test or Wilcoxon test: * p < 0.05; ** p < 0.01.
Figure 5
Figure 5
Torque steadiness. (A) Representative time course of torque output and EMG activity of vastus lateralis (VL) and rectus femoris (RF) during a 15-s isometric knee extension aiming at maintaining a 20% MVC torque output. Vertical grey dashed lines indicate the 10 s time windows with the lowest torque coefficient of variation that were considered for analysis. Attempts were performed before (Pre) and after (Post) priming protocol with spinal cord transcutaneous stimulation (scTS) or sham stimulation (Sham). (B) Torque coefficient of variation (CV), EMG amplitude (quantified by root mean square) and median power frequency (MDF) of knee extensors (KE, average value between VL and RF). (C) Post vs. Pre percent difference (Post-Pre-Δ%) assessed within the scTS or Sham priming session. Results in (B,C) are reported as individual data points (empty black triangles: scTS session; empty grey circles: Sham session) as well as mean and standard error. Note that individual data points are superimposed on error bars. No statistically significant difference found.
Figure 6
Figure 6
Recruitment curves. (A) Representative relationship between spinal cord transcutaneous stimulation (scTS) intensity and EMG peak-to-peak amplitude of vastus lateralis evoked potentials assessed before (Pre, grey empty squares) and after (Post, black empty triangles) scTS priming protocol. Each data point is the average peak-to-peak amplitude elicited by five stimuli. Exemplary evoked potentials to spinal stimulation (five individual responses are overlayed in grey; average response in black) corresponding to the maximum EMG peak-to-peak amplitude are also shown. (B) Vastus lateralis muscle activation threshold and (C) maximum EMG peak-to-peak amplitude assessed Pre and Post scTS priming protocol are reported as individual data points as well as mean and standard error. Note that individual data points are superimposed on error bars. No statistically significant difference found.

Similar articles

References

    1. Sarabia J.M., Moya-Ramón M., Hernández-Davó J.L., Fernandez-Fernandez J., Sabido R. The Effects of Training with Loads That Maximise Power Output and Individualised Repetitions vs. Traditional Power Training. PLoS ONE. 2017;12:e0186601. doi: 10.1371/journal.pone.0186601. - DOI - PMC - PubMed
    1. Suchomel T.J., Nimphius S., Bellon C.R., Stone M.H. The Importance of Muscular Strength: Training Considerations. Sports Med. 2018;48:765–785. doi: 10.1007/s40279-018-0862-z. - DOI - PubMed
    1. Sayer A.A., Kirkwood T.B.L. Grip Strength and Mortality: A Biomarker of Ageing? Lancet. 2015;386:226–227. doi: 10.1016/S0140-6736(14)62349-7. - DOI - PubMed
    1. Li R., Xia J., Zhang X.I., Gathirua-Mwangi W.G., Guo J., Li Y., McKenzie S., Song Y. Associations of Muscle Mass and Strength with All-Cause Mortality among US Older Adults. Med. Sci. Sports Exerc. 2018;50:458–467. doi: 10.1249/MSS.0000000000001448. - DOI - PMC - PubMed
    1. McKinnon N.B., Connelly D.M., Rice C.L., Hunter S.W., Doherty T.J. Neuromuscular Contributions to the Age-Related Reduction in Muscle Power: Mechanisms and Potential Role of High Velocity Power Training. Ageing Res. Rev. 2017;35:147–154. doi: 10.1016/j.arr.2016.09.003. - DOI - PubMed

LinkOut - more resources