Evolution of Chronic Kidney Disease in Different Regions of the World
- PMID: 40565888
- PMCID: PMC12194534
- DOI: 10.3390/jcm14124144
Evolution of Chronic Kidney Disease in Different Regions of the World
Abstract
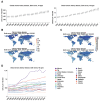
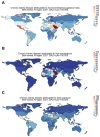
Background/Objectives: Chronic kidney disease (CKD) is a major global public health issue, affecting over 690 million individuals worldwide. The prevalence, diagnosis, and treatment of kidney disease vary considerably across different geographical regions. However, comprehensive and in-depth research on CKD remains limited due to its diverse etiologies. Methods: This study provides a detailed assessment of the disease burden of CKD, considering its etiological basis and utilizing the latest data reflecting changing trends. This research synthesizes findings from previous studies, with the necessary literature sourced from online platforms such as Google Scholar, EMBASE, and PubMed/MEDLINE databases, as well as Global Burden of Disease (GBD), to compare visualizations of the world's CKD levels and trends from 1990 to 2021. Results: The study results demonstrated that eating patterns are affected by historical and industrial factors, which likely contribute to the high prevalence of CKD in Western countries. The data also indicated that the global number of new CKD cases increased from just over 7.8 million in 1990 to nearly 19 million after 30 years. Additionally, the results showed that age and sex together accounted for the observed prevalence and disease-attributable disability-adjusted life year (DALY) rates in CKD, with the highest rates seen in older age groups, except for CKD attributed to type 1 diabetes, where the incidence was higher in children, and the burden was greater in middle-aged adults. Conclusions: Overall, these findings are a valuable addition to the existing literature and provide evidence that CKD studies over a similar time frame reveal notable global trends and regional differences in highlighting this increasing burden.
Keywords: chronic kidney disease (CKD); patterns; regional variations; trends.
Conflict of interest statement
The authors declare no conflicts of interest.
Figures


Similar articles
-
Systemic pharmacological treatments for chronic plaque psoriasis: a network meta-analysis.Cochrane Database Syst Rev. 2021 Apr 19;4(4):CD011535. doi: 10.1002/14651858.CD011535.pub4. Cochrane Database Syst Rev. 2021. Update in: Cochrane Database Syst Rev. 2022 May 23;5:CD011535. doi: 10.1002/14651858.CD011535.pub5. PMID: 33871055 Free PMC article. Updated.
-
Trends and levels of the global, regional, and national burden of appendicitis between 1990 and 2021: findings from the Global Burden of Disease Study 2021.Lancet Gastroenterol Hepatol. 2024 Sep;9(9):825-858. doi: 10.1016/S2468-1253(24)00157-2. Epub 2024 Jul 17. Lancet Gastroenterol Hepatol. 2024. PMID: 39032499 Free PMC article.
-
Systemic pharmacological treatments for chronic plaque psoriasis: a network meta-analysis.Cochrane Database Syst Rev. 2017 Dec 22;12(12):CD011535. doi: 10.1002/14651858.CD011535.pub2. Cochrane Database Syst Rev. 2017. Update in: Cochrane Database Syst Rev. 2020 Jan 9;1:CD011535. doi: 10.1002/14651858.CD011535.pub3. PMID: 29271481 Free PMC article. Updated.
-
Education support services for improving school engagement and academic performance of children and adolescents with a chronic health condition.Cochrane Database Syst Rev. 2023 Feb 8;2(2):CD011538. doi: 10.1002/14651858.CD011538.pub2. Cochrane Database Syst Rev. 2023. PMID: 36752365 Free PMC article.
-
Antidepressants for chronic non-cancer pain in children and adolescents.Cochrane Database Syst Rev. 2017 Aug 5;8(8):CD012535. doi: 10.1002/14651858.CD012535.pub2. Cochrane Database Syst Rev. 2017. PMID: 28779487 Free PMC article.
Cited by
-
Qualitative study on the sense of meaning in life in uremic patients undergoing initial hemodialysis.Int J Qual Stud Health Well-being. 2025 Dec;20(1):2545262. doi: 10.1080/17482631.2025.2545262. Epub 2025 Aug 19. Int J Qual Stud Health Well-being. 2025. PMID: 40827499 Free PMC article.
References
-
- Bello A.K., Okpechi I.G., Levin A., Ye F., Damster S., Arruebo S., Donner J.A., Caskey F.J., Cho Y., Davids M.R., et al. An update on the global disparities in kidney disease burden and care across world countries and regions. Lancet Glob. Health. 2024;12:e382–e395. doi: 10.1016/S2214-109X(23)00570-3. - DOI - PubMed
Grants and funding
LinkOut - more resources
Full Text Sources
Medical

