Assessing Gait Function in Lower Limb Rehabilitation: The Role of the Gait Analysis and Motion Score (GAMS)
- PMID: 40566119
- PMCID: PMC12193824
- DOI: 10.3390/jcm14124376
Assessing Gait Function in Lower Limb Rehabilitation: The Role of the Gait Analysis and Motion Score (GAMS)
Abstract
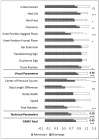
Background: Assessment of gait function is crucial for optimising rehabilitation outcomes. The gait analysis and motion score (GAMS) summarises qualitative and quantitative gait parameters from treadmill-based analyses to evaluate functional walking status. Objectives: To assess the sensitivity of the GAMS for detecting short-term changes, its test-retest reliability, and its correlation with the Western Ontario and McMaster Universities Osteoarthritis Index (WOMAC) and the Timed Up and Go (TUG) test. Methods: A retrospective analysis of 94 inpatient rehabilitation patients with hip, knee, or ankle impairments was performed. Changes in GAMS, WOMAC, and TUG scores and their interrelationships were assessed at both admission and discharge. Results: GAMS, WOMAC, and TUG showed significant improvements over time, with medium effect sizes (η2 = 0.303 to 0.434; p < 0.001). No significant differences in outcome measures were observed between groups. Moderate to strong correlations were found between pre- and post-rehabilitation scores for GAMS, TUG, and WOMAC (r = 0.58 to r = 0.90), indicating good test-retest reliability. A significant low negative correlation between GAMS and TUG was observed for all patients at admission (r = -0.30, p = 0.003) and discharge (r = -0.26, p = 0.030). No significant correlations were observed between GAMS and WOMAC in any patient group. Baseline GAMS scores significantly influenced change scores. Conclusions: GAMS is a sensitive and reliable tool for detecting short-term changes in gait parameters. GAMS and TUG assess related but distinct constructs, with GAMS and WOMAC assessing different domains of gait function. Therefore, GAMS provides complementary information not captured by WOMAC or TUG.
Keywords: gait analysis; healthcare; lower extremity; outcome assessment; rehabilitation; reproducibility of results.
Conflict of interest statement
The authors declare no conflicts of interest.
Figures


Similar articles
-
Exercise interventions and patient beliefs for people with hip, knee or hip and knee osteoarthritis: a mixed methods review.Cochrane Database Syst Rev. 2018 Apr 17;4(4):CD010842. doi: 10.1002/14651858.CD010842.pub2. Cochrane Database Syst Rev. 2018. PMID: 29664187 Free PMC article.
-
Adjunctive therapies in addition to land-based exercise therapy for osteoarthritis of the hip or knee.Cochrane Database Syst Rev. 2022 Oct 17;10(10):CD011915. doi: 10.1002/14651858.CD011915.pub2. Cochrane Database Syst Rev. 2022. PMID: 36250418 Free PMC article.
-
Systemic pharmacological treatments for chronic plaque psoriasis: a network meta-analysis.Cochrane Database Syst Rev. 2017 Dec 22;12(12):CD011535. doi: 10.1002/14651858.CD011535.pub2. Cochrane Database Syst Rev. 2017. Update in: Cochrane Database Syst Rev. 2020 Jan 9;1:CD011535. doi: 10.1002/14651858.CD011535.pub3. PMID: 29271481 Free PMC article. Updated.
-
Physical exercise training interventions for children and young adults during and after treatment for childhood cancer.Cochrane Database Syst Rev. 2016 Mar 31;3(3):CD008796. doi: 10.1002/14651858.CD008796.pub3. Cochrane Database Syst Rev. 2016. PMID: 27030386 Free PMC article.
-
Sertindole for schizophrenia.Cochrane Database Syst Rev. 2005 Jul 20;2005(3):CD001715. doi: 10.1002/14651858.CD001715.pub2. Cochrane Database Syst Rev. 2005. PMID: 16034864 Free PMC article.
References
-
- Naili J.E., Esbjornsson A.C., Iversen M.D., Schwartz M.H., Hedstrom M., Hager C.K., Brostrom E.W. The impact of symptomatic knee osteoarthritis on overall gait pattern deviations and its association with performance-based measures and patient-reported outcomes. Knee. 2017;24:536–546. doi: 10.1016/j.knee.2017.02.006. - DOI - PubMed
LinkOut - more resources
Full Text Sources

