

Leveraging Neural ODEs for Population Pharmacokinetics of Dalbavancin in Sparse Clinical Data
- PMID: 40566189
- PMCID: PMC12192077
- DOI: 10.3390/e27060602
Leveraging Neural ODEs for Population Pharmacokinetics of Dalbavancin in Sparse Clinical Data
Abstract
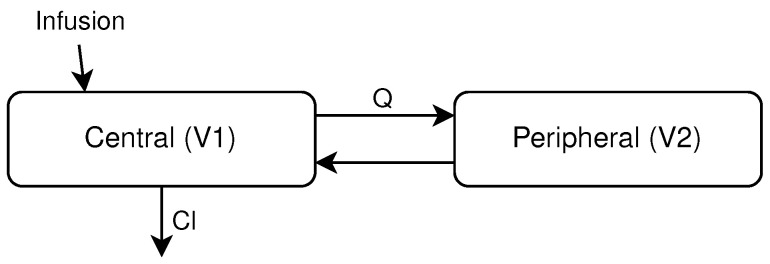
This study investigates the use of Neural Ordinary Differential Equations (NODEs) as an alternative to traditional compartmental models and Nonlinear Mixed-Effects (NLME) models for drug concentration prediction in pharmacokinetics. Unlike standard models that rely on strong assumptions and often struggle with high-dimensional covariate relationships, NODEs offer a data-driven approach, learning differential equations directly from data while integrating covariates. To evaluate their performance, NODEs were applied to a real-world Dalbavancin pharmacokinetic dataset comprising 218 patients and compared against a two-compartment model and an NLME within a cross-validation framework, which ensures an evaluation of robustness. Given the challenge of limited data availability, a data augmentation strategy was employed to pre-train NODEs. Their predictive performance was assessed both with and without covariates, while model explainability was analyzed using Shapley additive explanations (SHAP) values. Results show that, in the absence of covariates, NODEs performed comparably to state-of-the-art NLME models. However, when covariates were incorporated, NODEs demonstrated superior predictive accuracy. SHAP analyses further revealed how NODEs leverage covariates in their predictions. These results establish NODEs as a promising alternative for pharmacokinetic modeling, particularly in capturing complex covariate interactions, even when dealing with sparse and small datasets, thus paving the way for improved drug concentration predictions and personalized treatment strategies in precision medicine.
Keywords: deep learning; neural ODE; population pharmacokinetics; precision medicine.
Conflict of interest statement
The authors declare no conflicts of interest.
Figures


Similar articles
-
Intravenous magnesium sulphate and sotalol for prevention of atrial fibrillation after coronary artery bypass surgery: a systematic review and economic evaluation.Health Technol Assess. 2008 Jun;12(28):iii-iv, ix-95. doi: 10.3310/hta12280. Health Technol Assess. 2008. PMID: 18547499
-
A rapid and systematic review of the clinical effectiveness and cost-effectiveness of topotecan for ovarian cancer.Health Technol Assess. 2001;5(28):1-110. doi: 10.3310/hta5280. Health Technol Assess. 2001. PMID: 11701100
-
Cost-effectiveness of using prognostic information to select women with breast cancer for adjuvant systemic therapy.Health Technol Assess. 2006 Sep;10(34):iii-iv, ix-xi, 1-204. doi: 10.3310/hta10340. Health Technol Assess. 2006. PMID: 16959170
-
Home treatment for mental health problems: a systematic review.Health Technol Assess. 2001;5(15):1-139. doi: 10.3310/hta5150. Health Technol Assess. 2001. PMID: 11532236
-
Signs and symptoms to determine if a patient presenting in primary care or hospital outpatient settings has COVID-19.Cochrane Database Syst Rev. 2022 May 20;5(5):CD013665. doi: 10.1002/14651858.CD013665.pub3. Cochrane Database Syst Rev. 2022. PMID: 35593186 Free PMC article.
References
-
- Shargel L., Yu A.B. Applied Biopharmaceutics and Pharmacokinetics. 7th ed. McGraw-Hill Education; New York, NY, USA: 2016.
-
- Lee S.Y. Bayesian Nonlinear Models for Repeated Measurement Data: An Overview, Implementation, and Applications. Mathematics. 2022;10:898. doi: 10.3390/math10060898. - DOI
-
- Chen R.T.Q., Rubanova Y., Bettencourt J., Duvenaud D. Neural Ordinary Differential Equations. arXiv. 2018 doi: 10.48550/arXiv.1806.07366.1806.07366 - DOI
LinkOut - more resources
Full Text Sources
