

Cytokine Gene Expression and Treatment Impact on MRI Outcomes in Jordanian Patients with Multiple Sclerosis
- PMID: 40566512
- PMCID: PMC12193738
- DOI: 10.3390/life15060859
Cytokine Gene Expression and Treatment Impact on MRI Outcomes in Jordanian Patients with Multiple Sclerosis
Abstract
Background: Central nervous system autoimmune disorders, like multiple sclerosis (MS), are chronic conditions where cytokines contribute significantly to the regulation of inflammation. The diagnosis, progression, and treatment effectiveness of MS are assessed through laboratory tests and clinical evaluation, as well as imaging.
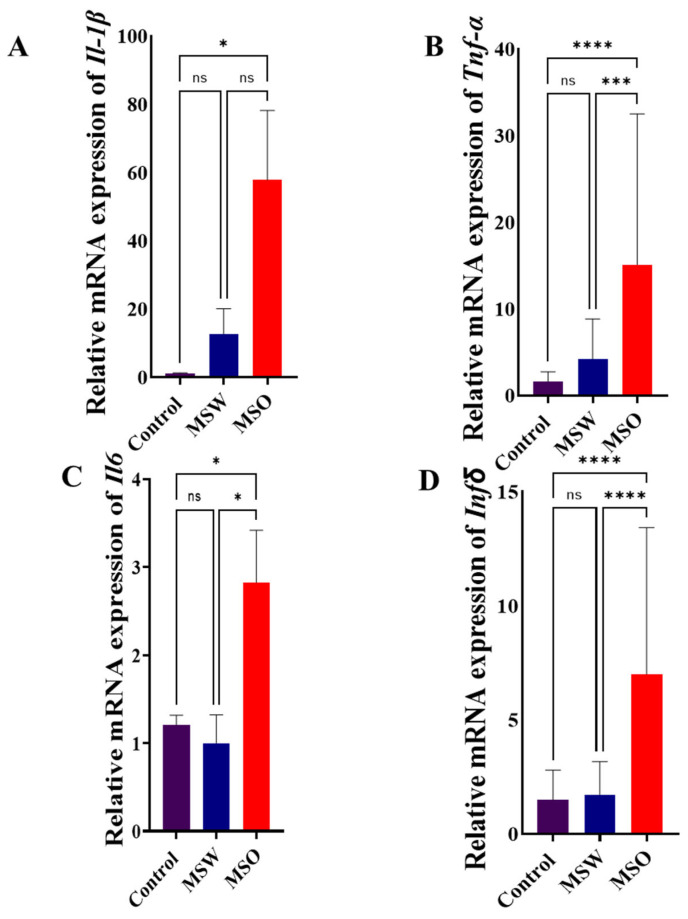
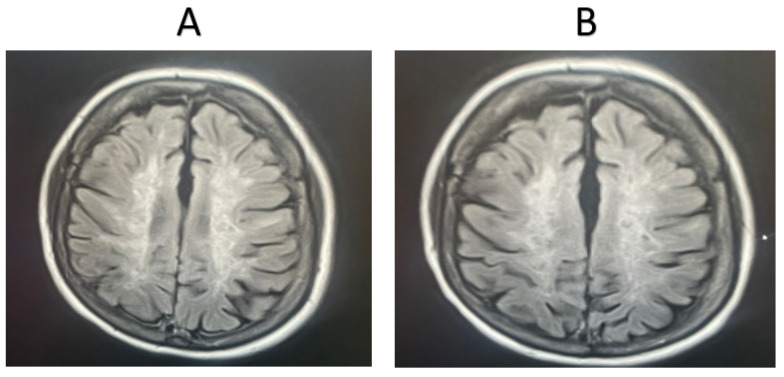
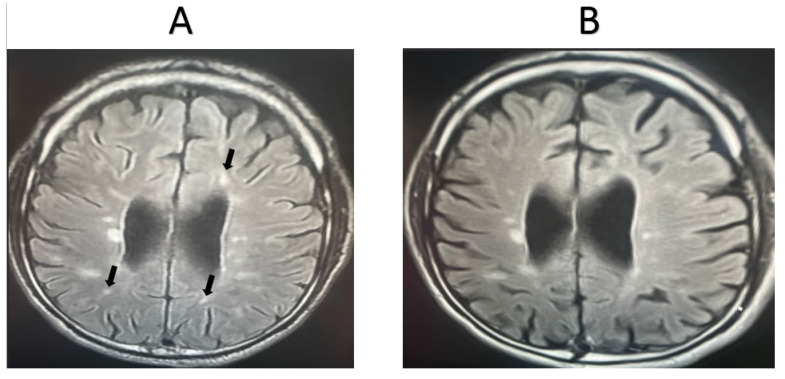
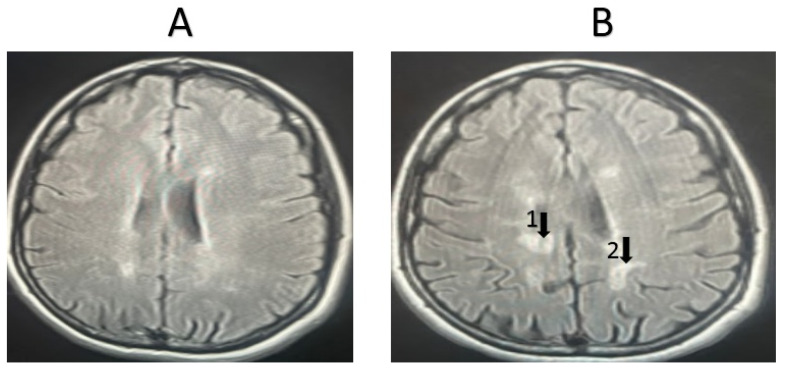
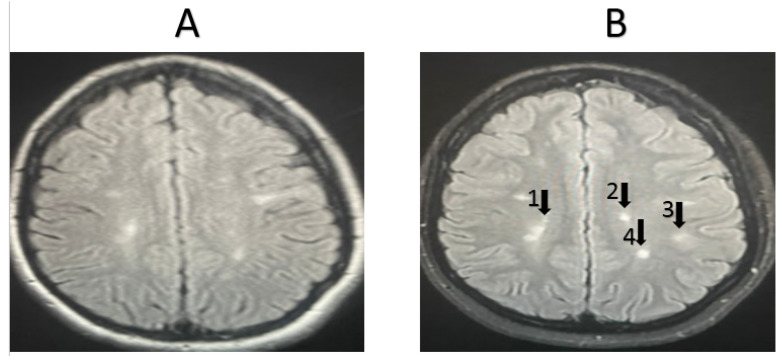
Method: This study included 40 healthy individuals as a control group and 75 MS patients, divided into two groups: 45 MS patients receiving fingolimod treatment (MSW) and 30 patients taking other medications (MSOs). Blood samples (3 mL) were collected from all participants, and the mRNA relative expression of cytokine genes (IL-1β, TNF-α, IL-6, and INF-γ) was measured. Additionally, MRI images of MS patients undergoing fingolimod or other treatments were analyzed.
Results: The MSO patient group displayed higher mRNA expressions of IL-1β, TNF-α, IL-6, and INF-γ compared to the control group. Furthermore, TNF-α, IL-6, and INF-γ expressions were elevated in the MSO group compared to the MSW group. MRI scans showed significant improvement in MS patients taking fingolimod compared to those receiving other medications.
Conclusions: Fingolimod demonstrated greater effectiveness in improving MS patients' conditions, possibly due to its impact on cytokine expression.
Keywords: Jordanians; MRI; cytokines; fingolimod; multiple sclerosis; relative gene expression.
Conflict of interest statement
The authors declare no conflicts of interest.
Figures
Similar articles
-
Fingolimod for relapsing-remitting multiple sclerosis.Cochrane Database Syst Rev. 2016 Apr 19;4(4):CD009371. doi: 10.1002/14651858.CD009371.pub2. Cochrane Database Syst Rev. 2016. PMID: 27091121 Free PMC article.
-
Teriflunomide for multiple sclerosis.Cochrane Database Syst Rev. 2016 Mar 22;3(3):CD009882. doi: 10.1002/14651858.CD009882.pub3. Cochrane Database Syst Rev. 2016. PMID: 27003123 Free PMC article.
-
Systemic pharmacological treatments for chronic plaque psoriasis: a network meta-analysis.Cochrane Database Syst Rev. 2021 Apr 19;4(4):CD011535. doi: 10.1002/14651858.CD011535.pub4. Cochrane Database Syst Rev. 2021. Update in: Cochrane Database Syst Rev. 2022 May 23;5:CD011535. doi: 10.1002/14651858.CD011535.pub5. PMID: 33871055 Free PMC article. Updated.
-
Natalizumab for relapsing remitting multiple sclerosis.Cochrane Database Syst Rev. 2011 Oct 5;(10):CD007621. doi: 10.1002/14651858.CD007621.pub2. Cochrane Database Syst Rev. 2011. PMID: 21975773
-
Immunomodulators and immunosuppressants for progressive multiple sclerosis: a network meta-analysis.Cochrane Database Syst Rev. 2024 Sep 10;9(9):CD015443. doi: 10.1002/14651858.CD015443.pub2. Cochrane Database Syst Rev. 2024. PMID: 39254048 Free PMC article.
References
-
- Coetzee T., Thompson A.J. Thompson, Atlas of MS 2020: Informing Global Policy Change. SAGE Publications Sage UK; London, UK: 2020. pp. 1807–1808. - PubMed
LinkOut - more resources
Full Text Sources
