. 2025 Jun 10;15(6):934.
doi: 10.3390/life15060934.

Protective Impacts of Chlorella vulgaris on Cisplatin-Induced Toxicity in Liver, Kidney, and Spleen of Rats: Role of Oxidative Stress, Inflammation, and Nrf2 Modulation

Affiliations

Protective Impacts of Chlorella vulgaris on Cisplatin-Induced Toxicity in Liver, Kidney, and Spleen of Rats: Role of Oxidative Stress, Inflammation, and Nrf2 Modulation

Layla A Almutairi et al. Life (Basel). .

Abstract

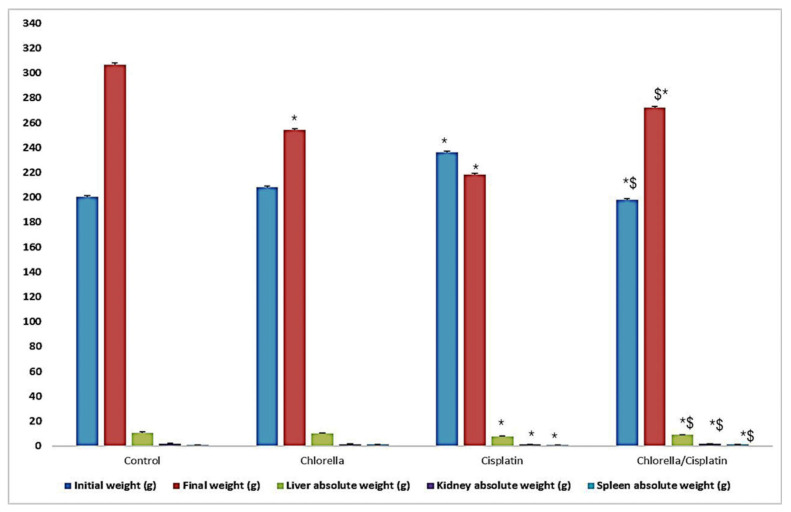
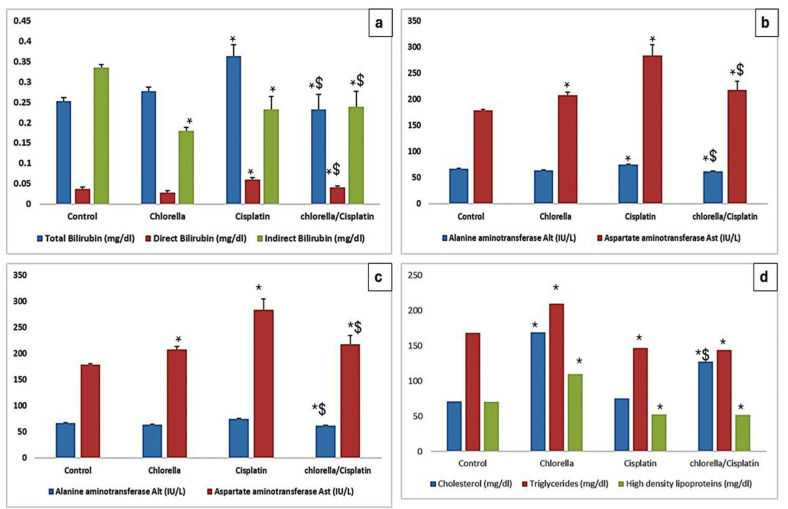
Cisplatin is a widely utilized chemotherapy drug effective against various cancers, yet its use is often constrained by severe toxicity to healthy organs, including the liver, kidneys, and spleen. This study explored the protective role of Chlorella vulgaris, a microalga known for its antioxidant and anti-inflammatory properties, against cisplatin-induced organ damage. The research focused on modulating oxidative stress, inflammation, and the Nrf2 signaling pathway. The experimental design included four groups: a control group receiving saline, a cisplatin group administered 1.34 mg/kg weekly for three months, a C. vulgaris group receiving 150 mg/kg daily, and a combined cisplatin/Chlorella vulgaris group. Cisplatin treatment significantly elevated oxidative stress markers, such as lipid peroxidation and nitric oxide, while increasing pro-inflammatory cytokines (TNF-α, IL-12, IL-6) and reducing antioxidant capacity. Additionally, liver and kidney function markers were markedly impaired, and histopathological analysis revealed structural damage in the liver, kidneys, and spleen. Conversely, C. vulgaris supplementation mitigated these effects, restoring oxidative stress markers, cytokine levels, and organ function to near-normal values. Microscopic examination confirmed that Chlorella vulgaris effectively prevented cisplatin-induced structural damage. Notably, while cisplatin increased Nrf2 expression as an adaptive response to oxidative stress, C. vulgaris attenuated this effect, reflecting its potent antioxidant capabilities.

Keywords: Chlorella vulgaris; Nrf2 signaling; cisplatin; inflammation; oxidative stress.


Conflict of interest statement

The authors declare no conflicts of interest.

Figures

Figure 1
Figure 1
Effect of Cisplatin and Chlorella supplement treatment on body, liver, kidney and spleen weights. Data were expressed as means ± SEM, n = 6. Data were statically analyzed using One-way ANOVA followed by Duncan’s multiple comparisons test. * Indicates p < 0.05 compared to the control group. $ indicates p < 0.05 compared to the cisplatin group.
Figure 2
Figure 2
Effect of Cisplatin and Chlorella supplement treatment on (ac) the measured marker of the hepatocellular injury and (d) some measured lipid profile (cholesterol, triglycerides, and low-density lipoproteins (LDL)). Data were expressed as means ± SEM, n = 6. Data were statically analyzed using One-way ANOVA followed by Duncan’s multiple comparisons test. * Indicates p < 0.05 compared to the control group. $ indicates p < 0.05 compared to the cisplatin group.
Figure 3
Figure 3
Effect of Cisplatin and C. vulgaris supplement treatment on Kidney Functions (creatinine, urea and uric acid) and Blood Ions (sodium, potassium and calcium). Data were expressed as means ± SEM, n = 6. Data were statically analyzed using One-way ANOVA followed by Duncan’s multiple comparisons test. * Indicates p < 0.05 compared to the control group. $ indicates p < 0.05 compared to the cisplatin group.
Figure 4
Figure 4
Effect of Cisplatin and Chlorella supplement treatment on serum total antioxidant capacity (TAC), lipid peroxidation biomarker malonaldehyde (MDA), Total nitric oxide (NO), Tumor necrosis factor (alpha) (TNF-α), Interlukin-6 (IL-6) and Interlukin-12 (IL-12). Data were expressed as means ± SEM, n = 6. Data were statically analyzed using One-way ANOVA followed by Duncan’s multiple comparisons test. * Indicates p < 0.05 compared to the control group. $ indicates p < 0.05 compared to the cisplatin group.
Figure 5
Figure 5
(a) Photomicrographs of the liver showed a normal structure with normal hepatocytes (HC) surrounding the central vein (CV) in the control rat. (b) Photomicrographs of the liver showed a normal structure with the normal portal area (PA) and bile duct in the treated rat with chlorella. (c) Photomicrographs of the liver showed the altered structure with fatty degenerated hepatocytes (FD) surrounding the central vein (CV) from rats treated with cisplatin. (d) Photomicrographs of the liver showed normal structure with normal hepatocytes surrounding the central vein to the treated group with cisplatin and chlorella. (e) Photomicrographs of the liver showed normal hepatocytes near the portal area (PA) from control rats. (f) Photomicrographs of the liver showed normal structure with normal hepatocytes surrounding the portal area (PA) from the chlorella-treated rats. (g) Photomicrographs of the liver showed infiltration of the hepatocytes surrounding the portal area (PA) with proliferation and hypertrophy of the bile duct (B) from rats treated with cisplatin. (h) Photomicrographs of the liver showed normal structure with normal hepatocytes surrounding the portal area (PA) from the chlorella/cisplatin group (H and E × 400).
Figure 6
Figure 6
(a) Photomicrographs of the kidney showed a normal Malpighian corpuscles structure (M) with a normal glomerulus surrounded with proximal convoluted tubules (T) from the control group. (b) Photomicrographs of the kidney showed a normal Malpighian corpuscles structure (M) with a normal glomerulus surrounded with proximal convoluted tubules (T) from the control group. (c) Photomicrographs of the kidney showed atrophic glomerulus (A) surrounded with dilated proximal and distal convoluted tubules and infiltration of inflammatory cells between tubules (IF) from the cisplatin group. (d) Photomicrographs of the kidney showed a normal Malpighian corpuscles structure (M) with a normal glomerulus surrounded with proximal convoluted tubules (T) from the chlorella/cisplatin group. (H and E × 400).
Figure 7
Figure 7
(a) Photomicrographs of the spleen of the control rat showed normal white pulp (WP) and red pulp (RP). (b) Photomicrographs of the spleen of a treated rat with chlorella showed normal white pulp (WP) and red pulp (RP). (c) Photomicrographs of the spleen of a treated rat with cisplatin showed marginal zone hyperplasia of the white pulp (WP) and normal hematogenous red pulp (RP). (H and E × 200). (d) Photomicrographs of the spleen of treated rats with chlorella and cisplatin showed normal white pulp (WP) and red pulp (RP). (H and E × 200).
Figure 8
Figure 8
Immunoexpressing nuclear erythroid factor 2 (Nrf2) in the sections of the liver and kidney of rats belonging to the control group and treated groups. (a,b) Liver sections of control rats and rats treated with chlorella showed mild brown immunoexpressing of Nrf2 in the hepatocytes (arrow). (c) Liver sections of rats treated with cisplatin showed severe brown immunoexpressing of Nrf2 in the hepatocytes (arrow). (d) Liver sections of the group pretreated with chlorella before injection with cisplatin showed mild brown immunoexpressing of Nrf2 in the hepatocytes (arrow). (200×). (e) Histogram of the mean percentage areas of Nrf2 protein expression in the hepatocytes of different groups. * Indicates p < 0.05 compared to the control group. $ indicates p < 0.05 compared to the cisplatin group.
Figure 9
Figure 9
Immunoexpressing of nuclear erythroid factor 2 (Nrf2) in the sections of the kidney of rats belonging to the control group and treated groups. (a,b) The kidney section of control rats and rats treated with chlorella showed mild brown immunoexpressing of Nrf2 in the kidney (arrow). (c) The kidney section of rats treated with cisplatin showed severe brown immunoexpressing of Nrf2 in the kidney (arrow). (d) Kidney sections of the group pretreated with chlorella before injection with cisplatin showed mild brown immunoexpressing of Nrf2 in the kidney (arrow). (200×). (e) Histogram of the mean percentage areas of Nrf2 protein expression in the kidneys of different groups. * Indicates p < 0.05 compared to the control group. $ indicates p < 0.05 compared to the cisplatin group.
Figure 10
Figure 10
(a) An electron micrograph of the liver from the control group showed ideal hepatocytes with a normally round nucleus (N) and nucleolus with evenly distributed chromatin, sometimes slightly condensed along the nuclear membrane in hepatocytes; the nucleus is easily distinguished. There are numerous round, oval, elongated rod-like mitochondria (M) with membranous cristae and electron-dense matrix. The normal rough endoplasmic reticulum (RER) and the smooth endoplasmic reticulum occurred in glycogen-rich areas (G). (b) An electron micrograph of the liver from the chlorella group showed exhibited ideal hepatocytes with normally round nucleus (N) and nucleolus (Nu) with evenly distributed chromatin, sometimes slightly condensed along the nuclear membrane in hepatocytes; the nucleus is easily distinguished. There are numerous round, oval, elongated rod-like mitochondria (M) with membranous cristae and electron-dense matrix and lipid droplets (L). The normal rough endoplasmic reticulum (RER) and the smooth endoplasmic reticulum occurred in glycogen-rich areas (G). (c) An electron micrograph of the liver from the cisplatin group showed ultrastructure alteration, including irregularity to the contour of the nucleus (N) with dense nucleolus (NU). Shrunken nuclei (arrow) with condensed chromatin in the hepatocyte were seen. The cytoplasm was vacuolated (V) and dissolute with increased glycogen granules (G). Numerous round, oval, elongated rod-like mitochondria (M), and lipid droplets are present. (d) An electron micrograph of the liver from the chlorella/cisplatin group showed ideal hepatocytes and sinusoid (S). The hepatocytes have a normally round nucleus (N) and nucleolus (Nu) with evenly distributed chromatin, sometimes slightly condensed along the nuclear membrane in hepatocytes; the nucleus is easily distinguished. Numerous round, oval, elongated rod-like mitochondria (M) matrix, and lipid droplets (L) are presented. The normal rough endoplasmic reticulum (RER) and the smooth endoplasmic reticulum occurred in glycogen-rich areas (G).
Figure 11
Figure 11
(a) An electron micrograph of the kidney from the control group showed convoluted tubules with an active nucleus (N) with nucleoli. Elongated mitochondria (M) on a highly developed basal membrane and a microvillus (MV) along the luminal border. (b) An electron micrograph of the kidney from the chlorella group showed convoluted tubules with an active nucleus (N) with nucleoli. Elongated mitochondria (M) on a highly developed basal membrane were observed. (c) An electron micrograph of the kidney from the cisplatin group showed convoluted tubules with a condensed chromatin nucleus (N), degenerated mitochondria and vacuolated cytoplasm (arrow). (d) An electron micrograph of the kidney from the chlorella/cisplatin group showed convoluted tubules with an active nucleus (N) with mildly irregular contour with nucleoli. Elongated mitochondria (M) on a highly developed basal membrane were observed.
Figure 12
Figure 12
(a) An electron micrograph of the spleen from the control group showed normal ultrastructure of multiple lymphocytes of nuclei with chromatin that homogenously distributed (L). The red pulp is lined by endothelial cells (E) with red blood cells (R) between them. (b) An electron micrograph of the spleen from the chlorella group showed normal ultrastructure of multiple lymphocytes of nuclei with chromatin that homogenously distributed (L), macrophage (M), and plasma cells (P). The red pulp between its red blood cells. (c) An electron micrograph of the spleen from the control group showed lymphocytes with different degrees of marginal condensed chromatin in their nuclei. Most of the cytoplasm showed disintegrated organelles. (d) An electron micrograph of the spleen from the chlorella/cisplatin group showed normal ultrastructure of multiple lymphocytes of nuclei with chromatin that homogenously distributed (L) and plasma cells (P). The red pulp is lined with endothelial cells (E) between its red blood cells.

Similar articles

References

    1. Rampling R., James A., Papanastassiou V. The present and future management of malignant brain tumours: Surgery, radiotherapy, chemotherapy. J. Neurol. Neurosurg. Psychiatry. 2004;75:ii24–ii30. doi: 10.1136/jnnp.2004.040535. - DOI - PMC - PubMed
    1. Elkelish A., Abu-Elsaoud A.M.M. Crosstalk Between Abiotic and Biotic Stress Responses in Plants: Mechanisms, Outcomes, and Implications for Crop Improvement. Spectr. Sci. J. 2024;1:27–34. doi: 10.21608/sasj.2024.396598. - DOI
    1. Astolfi L., Ghiselli S., Guaran V., Chicca M., Simoni E., Olivetto E., Lelli G., Martini A. Correlation of adverse effects of cisplatin administration in patients affected by solid tumours: A retrospective evaluation. Oncol. Rep. 2013;29:1285–1292. doi: 10.3892/or.2013.2279. - DOI - PMC - PubMed
    1. Boulikas T., Vougiouka M. Recent clinical trials using cisplatin, carboplatin and their combination chemotherapy drugs. Oncol. Rep. 2004;11:559–595. doi: 10.3892/or.11.3.559. - DOI - PubMed
    1. Wang D., Lippard S.J. Cellular processing of platinum anticancer drugs. Nat. Rev. Drug Discov. 2005;4:307–320. doi: 10.1038/nrd1691. - DOI - PubMed

LinkOut - more resources