

Alterations in the functional MRI-based temporal brain organisation in individuals with obesity
- PMID: 40566750
- PMCID: PMC12326918
- DOI: 10.1111/dom.16565
Alterations in the functional MRI-based temporal brain organisation in individuals with obesity
Abstract
Aims: Obesity is associated with functional alterations in the brain. Although spatial organisation changes in the brains of individuals with obesity have been widely studied, the temporal dynamics in their brains remain poorly understood. Therefore, in this study, we investigated variations in the intrinsic neural timescale (INT) across different degrees of obesity using resting-state functional and diffusion magnetic resonance imaging data from the enhanced Nathan Kline Institute Rockland Sample database.
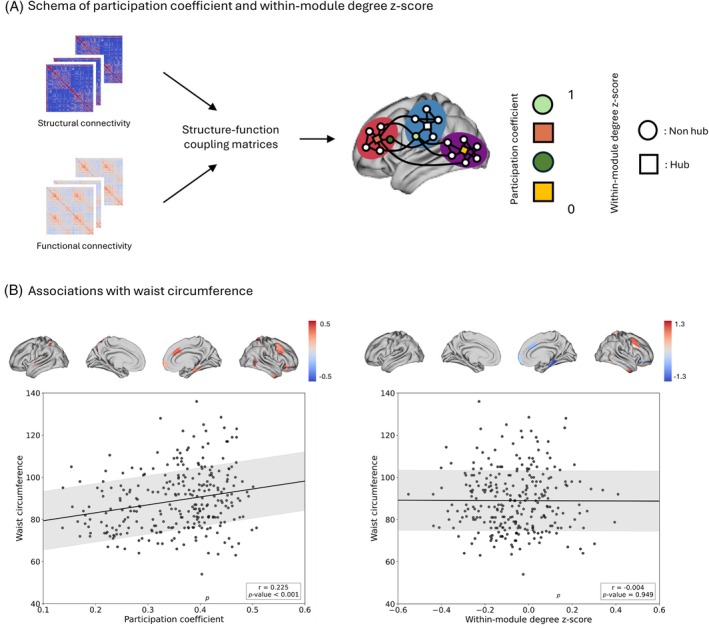
Materials and methods: We examined the relationship between the INT and obesity phenotypes using supervised machine learning, controlling for age and sex. To further explore the structure-function characteristics of these regions, we assessed the modular network properties by analysing the participation coefficients and within-module degree derived from the structure-function coupling matrices. Finally, the INT values of the identified regions were used to predict eating behaviour traits.
Results: A significant negative correlation was observed, particularly in the default mode, limbic and reward networks. We found a negative association with the participation coefficients, suggesting that shorter INT values in higher-order association areas are related to reduced network integration. Moreover, the INT values of these identified regions moderately predicted eating behaviours, underscoring the potential of the INT as a candidate marker for obesity and eating behaviours.
Conclusions: These findings provide insight into the temporal organisation of neural activity in obesity, highlighting the role of specific brain networks in shaping behavioural outcomes.
Keywords: eating behaviours; functional connectivity; intrinsic neural timescale; modular parameters; obesity; structural connectivity.
© 2025 The Author(s). Diabetes, Obesity and Metabolism published by John Wiley & Sons Ltd.
Conflict of interest statement
The authors declare no conflicts of interest.
Figures


Similar articles
-
Short-Term Memory Impairment.2024 Jun 8. In: StatPearls [Internet]. Treasure Island (FL): StatPearls Publishing; 2025 Jan–. 2024 Jun 8. In: StatPearls [Internet]. Treasure Island (FL): StatPearls Publishing; 2025 Jan–. PMID: 31424720 Free Books & Documents.
-
Predicting cognitive decline: Deep-learning reveals subtle brain changes in pre-MCI stage.J Prev Alzheimers Dis. 2025 May;12(5):100079. doi: 10.1016/j.tjpad.2025.100079. Epub 2025 Feb 6. J Prev Alzheimers Dis. 2025. PMID: 39920001 Free PMC article.
-
A Method for Estimating Dynamic Functional Network Connectivity Gradients (dFNGs) From ICA Captures Smooth Inter-Network Modulation.Hum Brain Mapp. 2025 Jul;46(10):e70262. doi: 10.1002/hbm.70262. Hum Brain Mapp. 2025. PMID: 40626410 Free PMC article.
-
Systemic pharmacological treatments for chronic plaque psoriasis: a network meta-analysis.Cochrane Database Syst Rev. 2021 Apr 19;4(4):CD011535. doi: 10.1002/14651858.CD011535.pub4. Cochrane Database Syst Rev. 2021. Update in: Cochrane Database Syst Rev. 2022 May 23;5:CD011535. doi: 10.1002/14651858.CD011535.pub5. PMID: 33871055 Free PMC article. Updated.
-
Psychological interventions for adults who have sexually offended or are at risk of offending.Cochrane Database Syst Rev. 2012 Dec 12;12(12):CD007507. doi: 10.1002/14651858.CD007507.pub2. Cochrane Database Syst Rev. 2012. PMID: 23235646 Free PMC article.
References
MeSH terms
Grants and funding
- RS-2024-00415812/National Research Foundation of Korea
- IITP-2025-RS-2022-00156225/Institute for Information and Communications Technology Promotion
- 2022-0-00448/RS-2022-II220448/Institute for Information and Communications Technology Promotion
- RS-2021-II212068/Institute for Information and Communications Technology Promotion
LinkOut - more resources
Full Text Sources
Medical
