. 2025 Jul 14;65(13):7143-7155.
doi: 10.1021/acs.jcim.5c00552. Epub 2025 Jun 26.

Identification of New Human P2X7 Antagonists Using Ligand- and Structure-Based Virtual Screening

Affiliations

Identification of New Human P2X7 Antagonists Using Ligand- and Structure-Based Virtual Screening

Marika Zuanon et al. J Chem Inf Model. .

Abstract

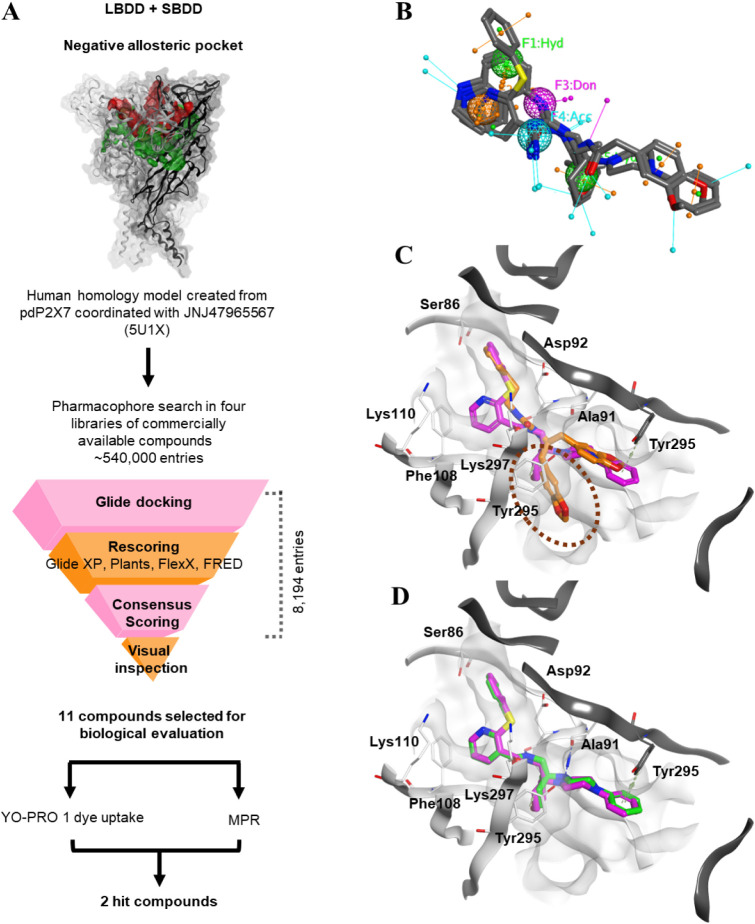
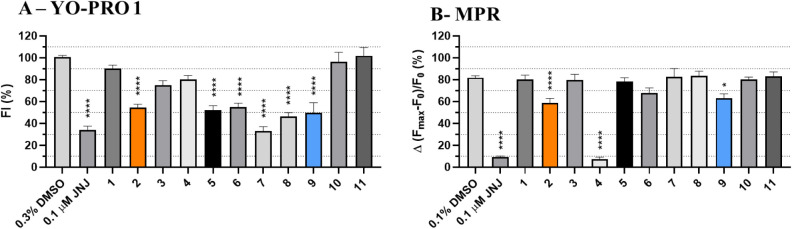
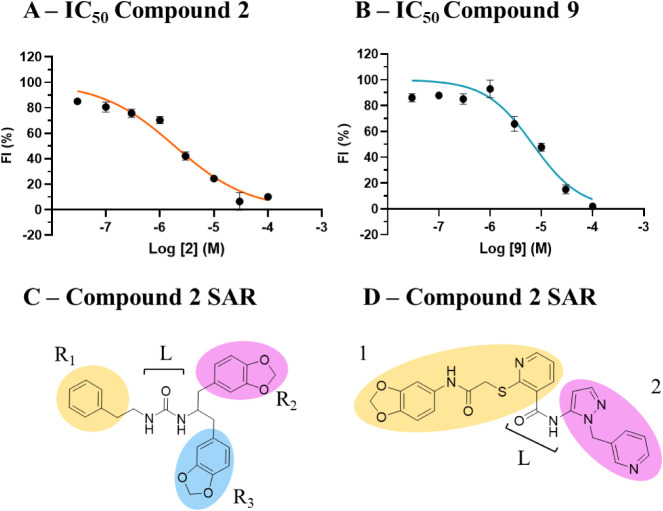
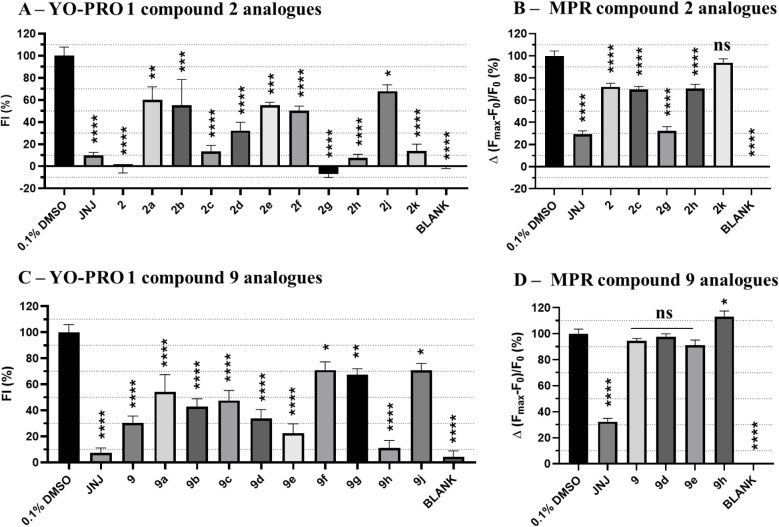
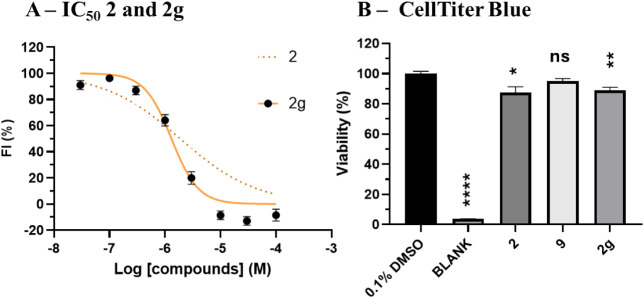
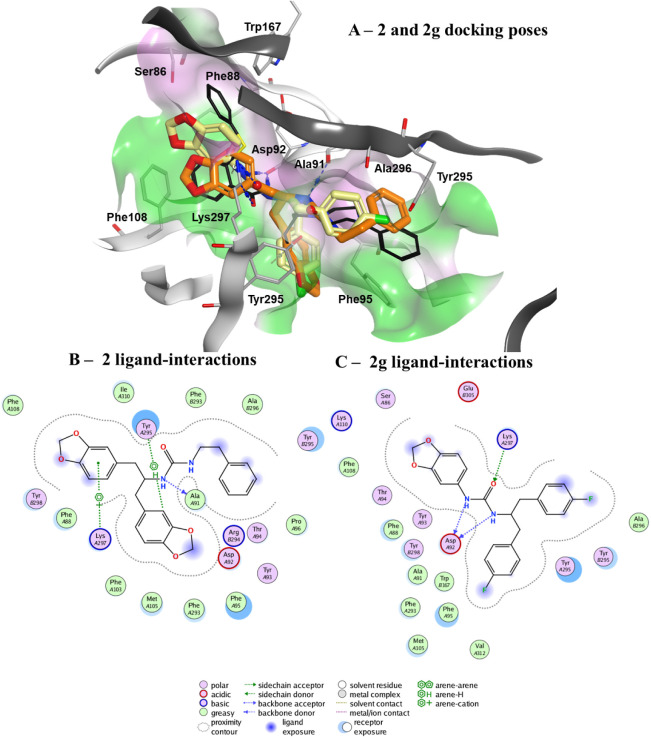
P2X7 receptors, a subtype of ATP-gated cation channel, have gained attention due to their involvement in inflammatory and neurodegenerative diseases, chronic pain, and cancer. However, despite extensive medicinal chemistry efforts, no P2X7 antagonists have reached clinical approval due to suboptimal pharmacokinetic properties, poor selectivity, and insufficient efficacy in comparison to placebo controls. To address these challenges, we employed a virtual screening workflow integrating ligand-based and structure-based approaches to identify novel P2X7 allosteric antagonists. A 3D pharmacophore model derived from three known P2X7 antagonists (A740003, A804598, and JNJ47965567) was used to filter four libraries of commercially available compounds (approximately 10,000,000 total). These compounds were docked into a human P2X7 homology model and ranked by four distinct scoring functions. Eleven compounds were selected based on drug-like properties and key interactions with residues lining the target pocket. Among those, six compounds inhibited P2X7 activation in a YO-PRO 1 dye uptake assay (30 μM), while just two of those (2 and 9) were also active in a Membrane Potential Red assay (10 μM). Further screening of 10 analogues of 2 and 9 led to the identification of 2g, which displayed comparable potency (IC50 = 1.31 μM) to 2 (IC50 = 1.88 μM) in the YO-PRO 1 dye uptake assay. Docking studies of 2g within the negative allosteric pocket provided insights into its binding mode and key interacting residues. These findings offer a promising starting point for the development of optimized P2X7 antagonists.


Figures

1
1
Virtual screening and visual inspection in the negative allosteric pocket. (A) Schematic of the VS performed in the hP2X7 negative allosteric pocket (red surface), which is adjacent to the ATP pocket (green surface). (B) Five features selected for the pharmacophore search superposing A740003 (PDB ID: 5U1U), A804598 (PDB ID: 5U1 V), and JNJ47965567 (PDB ID: 5U1X); (F1 and F5 in green are two lipophilic groups; F2 in orange is an aromatic group; F3 in pink, and F4 in cyan are two hydrogen groups, donor and acceptor, respectively). (C) Visualization of the novel area (highlighted by the oval shape) of the pocket occupied by the entries 2, 4, and 7 found in the VS. (D) The JNJ47965567 docked pose in VS (green) overlaps that of the cocrystallized ligand (pink) in pdP2X7 (PDB ID 5U1X). LBDD, ligand-based drug design; MPR, Membrane Potential Red assay; pdP2X7, giant panda P2X7; and SBDD, structure-based drug design.
2
2
Initial screening assays to identify hit compounds. (A) The compounds were screened at 30 μM in the YO-PRO 1 dye uptake using 1321 N1 cells stably transfected with hP2X7. Compound activity was evaluated along a time of 20 min (75 s per cycle) after ATP addition (700 μM). The fluorescence intensity (FI) values of the first 10 cycles were considered for assessing their ability to inhibit hP2X7. Compound responses were normalized to the fluorescent signal recorded on 0.3% DMSO cells treated with 700 μM ATP of each plate. The graph shows the results obtained from three independent repeats (n = 4 per experiment). (B) Compounds screened at 10 μM using MPR using 1321 N1 cells stably transfected with hP2X7. The compound activity was evaluated for 5 min after ATP addition (15 s per cycle). The fluorescence intensity recorded in the first cycles (before reaching a plateau response) was considered for assessing the small molecule’s ability to inhibit hP2X7. Compound responses were normalized to the fluorescence signal recorded on 0.1% DMSO cells treated with 700 μM ATP of each plate. The graph shows the results obtained from three biological replicates (6 technical replicates per experiment; error bars represent the SEM from the means of each biological replicate (n = 3)). One-way ANOVA and Dunnet test were used for statistical analysis (****P < 0.0001), (*P < 0.02).
3
3
Inhibitory concentration response evaluation of compounds 2 and 9 and their groups highlighted for SAR. IC50 was determined for 2 (IC50 = 1.875 μM) (A) and 9 (IC50 = 6.820 μM) (B) by YO-PRO 1 (5 μM) assay. Compound activity was evaluated along a time of 20 min (75 s per cycle) after ATP addition (700 μM). The fluorescence intensity (FI) values of the first 10 cycles were considered for assessing their ability to inhibit hP2X7. The curves represent three biological replicates (n = 4 per replicate). Data were normalized by setting as 100% the FI recorded by hP2X7 HEK-293 cells incubated in 1% DMSO and stimulated by ATP, and as 0% the FI recorded by the same cells but treated with ECS-LD (assay buffer). (C) Highlighted areas of compound 2 considered for SAR study. R1 refers to the ethyl-benzyl group of the molecules, and R2 and R3 refer to the benzo-(1,3)-dioxol groups. (D) Highlighted areas of compound 9 considered for SAR study. We have defined the area highlighted in yellow and numbered as 1 as the “front” region of the molecule and the one colored in pink and named as 2 as the “back” region of the molecule. L highlights the urea and amide linkers of compounds 2 and 9, respectively.
4
4
Evaluation of compound 2 and 9 analogue activity using YO-PRO 1 and MPR assays. The activity of compound 2 (A and B) and 9 (C and D) analogues was evaluated in YO-PRO 1 (A and C) and MPR (B and D) assays. The compounds were tested at 10 μM and preincubated for either 20 (YO-PRO 1) or 30 min (MPR). The baseline was recorded for 5 cycles before ATP treatment (1 mM). Fluorescence was recorded for 25 (YO-PRO 1) or 5 min (MPR). The data were normalized by setting as 100% for the fluorescence measured from hP2X7 HEK-293 cells incubated with vehicle (0.1% DMSO) and treated with 1 mM ATP and 0% for the fluorescence recorded by the cells not treated with ATP. The data shown correspond to three independent biological replicates (3 technical replicates per experiment; error bars represent the SEM from the mean values of each biological replicate (n = 3)). The statistical analysis was performed with one-way Anova using Dunnett’s function (P**** < 0.0001; P*** < 0.0003; P** < 0.002; P* < 0.02).
5
5
Concentration inhibition curve determination for compound 2g (A) and evaluation of cytotoxicity for compounds 2, 9, and 2g. (A) IC50 comparison between 2g (solid line) (1.31 ± 0.2 μM) and 2 (dotted linedata from Figure A) (1.875 μM). The data on the graph represent the mean from three independent experiments (n = 3 replicates per experiment). (B) The cytotoxicity of the compounds was evaluated on nontransfected HEK-293 cells using a CellTiter Blue assay. The cells were incubated for 24 h with the compounds at 10 μM. The fluorescent signal obtained from vehicle-treated cells (0.1% DMSO) was used to normalize the data to 100%, and the one obtained from wells not containing cells (BLANK) was set as 0%. The data are the combination of three biological replicates (error bars represent the SEM (n = 3)) analyzed by one-way ANOVA using Dunnet’s function (P**** < 0.0001; **< 0.002; * < 0.02; ns, non significant).
6
6
Predicted binding mode of 2g to the hP2X7 negative allosteric pocket. (A) 2g (carbon atoms in yellow), is overlaid with 2, (carbon atoms in orange), and the cocrystallized JNJ47965567 (JNJ; black sticks). The receptor binding surface is represented in green (lipophilic) and pink (hydrophilic). Interactions between the ligands, 2 and 2g, and the receptor are represented in blue (hydrogen bonds) and green dotted lines (lipophilic interactions). (B) Compound 2 ligand interaction diagram. (C) Compound 2g ligand interaction diagram (see key above).

Similar articles

References

    1. North R. A.. Molecular Physiology of P2X Receptors. Physiol. Rev. 2002;82(4):1013–1067. doi: 10.1152/physrev.00015.2002. - DOI - PubMed
    1. North R. A., Buell G.. P2X purinoceptor plethora. Semin. Neurosci. 1996;272(May):187–194. doi: 10.1006/smns.1996.0024. - DOI
    1. Virgilio F. D., Sarti A. C., Coutinho-Silva R.. Purinergic Signaling, DAMPs, and Inflammation. Am. J. Physiol. Cell Physiol. 2020;318(5):C832–C835. doi: 10.1152/ajpcell.00053.2020. - DOI - PubMed
    1. Giuliani A. L., Sarti A. C., Di Virgilio F.. Extracellular Nucleotides and Nucleosides as Signalling Molecules. Immunol. Lett. 2019;205:16–24. doi: 10.1016/j.imlet.2018.11.006. - DOI - PubMed
    1. Orioli E., De Marchi E., Giuliani A. L., Adinolfi E.. P2 × 7 Receptor Orchestrates Multiple Signalling Pathways Triggering Inflammation, Autophagy and Metabolic/Trophic Responses. Curr. Med. Chem. 2017;24(21):2261–2275. doi: 10.2174/0929867324666170303161659. - DOI - PubMed

MeSH terms

Substances

LinkOut - more resources