. 2025 Jul;14(13):e70958.
doi: 10.1002/cam4.70958.

STOX1 Isoform A Promotes Proliferation and Progression of Hepatocellular Carcinoma by Dual Mechanisms of Transcriptionally Upregulation of Cyclin B1 and Activation of ROS-Dependent PTEN/AKT1 Signaling

Affiliations

STOX1 Isoform A Promotes Proliferation and Progression of Hepatocellular Carcinoma by Dual Mechanisms of Transcriptionally Upregulation of Cyclin B1 and Activation of ROS-Dependent PTEN/AKT1 Signaling

Chunlin Jiang et al. Cancer Med. 2025 Jul.

Abstract

Background: Dysregulation of transcription factors is one of the most common factors for the pathogenesis of hepatocellular carcinoma (HCC). To the best of our knowledge, no study has yet investigated the clinical significance and functional role of STOX1 in HCC.

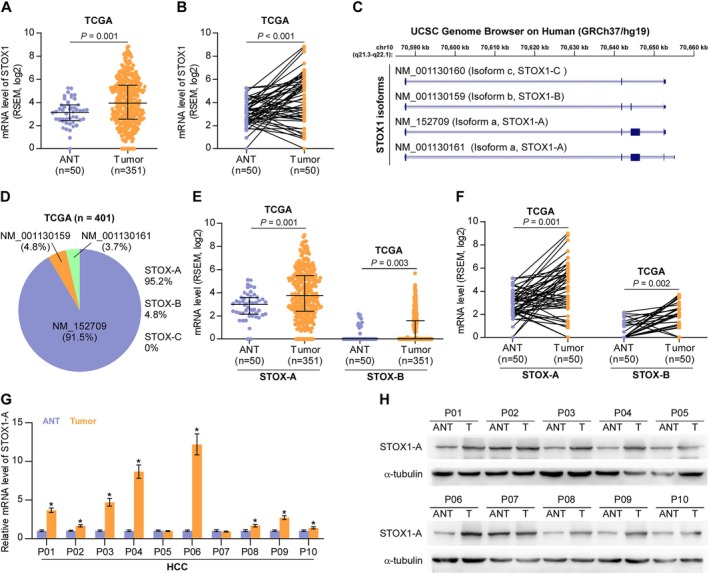
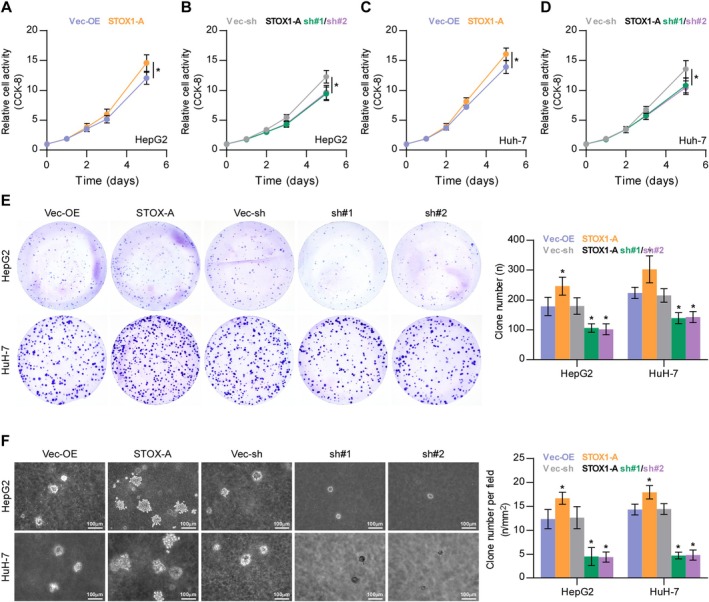
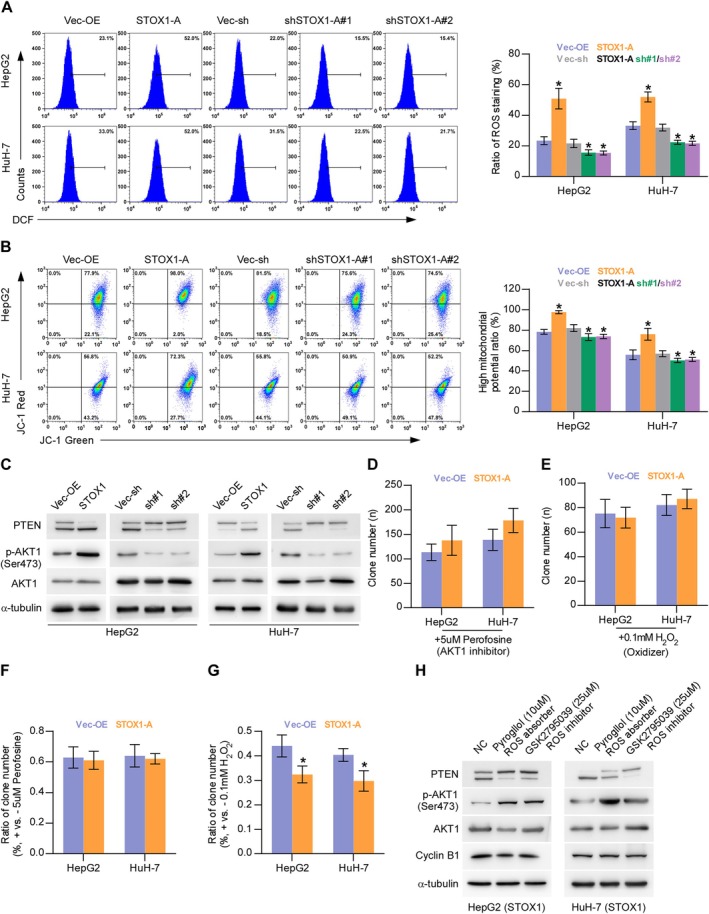
Methods: Real-time PCR, Western blotting and immunohistochemistry were performed to examine the expression of STOX1-A in HCC specimens. Animal experiment in vivo and functional cell assays in vitro were used to investigate the tumorigenic and proliferative ability of HCC cells. Luciferase and ROS assays were depolyed to investigate the molecular mechanisms underlying the biologic role of STOX1-A in HCC.

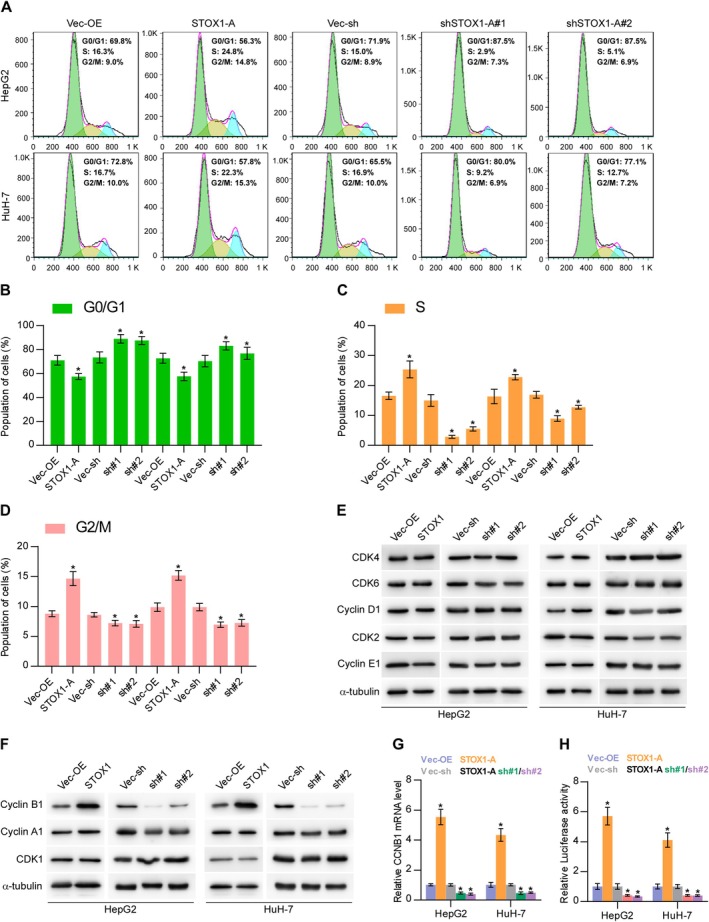
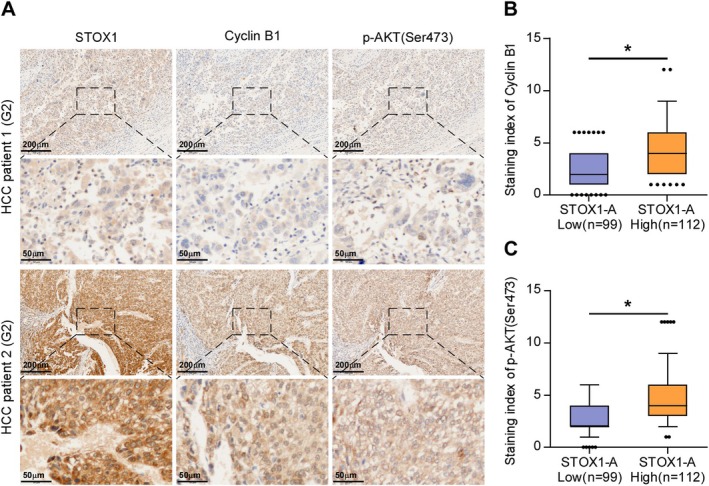
Results: In this study, we report that STOX1 isoform A (STOX1-A) is significantly upregulated in HCC tissues, and elevated STOX1-A levels are associated with poorer overall survival and progression-free survival in HCC patients. Functional assays demonstrated that STOX1-A upregulation promotes, whereas its silencing suppresses, HCC cell proliferation and growth both in vitro and in vivo. Mechanistic investigations revealed a dual mechanism by which STOX1-A drives HCC progression. First, STOX1-A transcriptionally upregulates cyclin B1, promoting cell proliferation. Second, it activates the AKT1 signaling pathway through reactive oxygen species (ROS)-mediated deactivation of PTEN. Furthermore, a positive correlation between STOX1-A expression and the levels of cyclin B1 and phosphorylated AKT1 (p-AKT1 Ser473) was observed in clinical HCC samples.

Conclusion: Our findings identify a novel dual mechanism by which STOX1-A promotes HCC proliferation and growth, offering potential avenues for the development of anti-tumor therapeutic strategies targeting STOX1-A in HCC.

Keywords: AKT1 signaling pathway; STOX1 isoform A; cell proliferation and cell cycle; hepatocellular carcinoma; reactive oxygen species.


Conflict of interest statement

The authors declare no conflicts of interest.

Figures

FIGURE 1
FIGURE 1
STOX1‐A is upregulated in HCC. (A) STOX1 expression in 50 adjacent normal tissues (ANT) and 351 HCC tissues in HCC dataset from TCGA. (B) STOX1 expression in 50 paired ANT and HCC tissues in HCC dataset from TCGA. (C) Analysis of STOX1 isoform using UCSC genome. (D) Different isoform expression of STOX1, including STOX1‐A STOX1‐B, and STOX1‐C, depicted in bar graph in HCC dataset from TCGA. (E) STOX1‐A and STOX1‐B expression in 50 adjacent normal tissues (ANT) and 351 HCC tissues in HCC dataset from TCGA. (F) STOX1‐A and STOX1‐B expression in 50 paired ANT and HCC tissues in HCC dataset from TCGA. (G, H) Real‐time PCR (G) and Western blot (H) analysis of STOX1‐A expression in 10 clinical paired ANT and HCC tissues.
FIGURE 2
FIGURE 2
High expression of STOX1‐A correlates with poor prognosis in HCC patients. (A) Analysis of STOX1 expression in benign inflammatory liver lesion, benign hyperplastic liver lesion and HCC with different grades using immunohistochemical (IHC) staining. Upper panel: 4× magnification, scale bar, 200 μm; lower panel: 20× magnification, scale bar, 50 μm. (B) The number of different staining index of STOX1‐A in benign and HCC tissues. (C) Staining index of STOX1‐A in benign and malignant HCC tissues. (D) Staining index of STOX1‐A in benign and HCC tissues with different grade. n.s., no significant difference. (E) Staining index of STOX1‐A in benign and HCC tissues with different T stage. (F) Staining index of STOX1‐A in benign and HCC tissues with different clinical stage. (G) Kaplan–Meier progression‐free survival analysis of HCC patients stratified by high and low STOX1‐A levels.
FIGURE 3
FIGURE 3
STOX1‐A promotes proliferation of HCC cells in vitro. (A–D) The effect of STOX1‐A overexpression or downexpression on proliferation of HCC cells using CCK‐8 assay. *p < 0.05. (E) The effect of STOX1‐A overexpression or downexpressio on proliferation of HCC cells using colony‐formation assay. *p < 0.05. (F) The effect of STOX1‐A overexpression or downexpressio on proliferation of HCC cells using soft agar colony‐formation assay. *p < 0.05.
FIGURE 4
FIGURE 4
STOX1‐A promotes tumorigenesis of HCC cells in vivo. (A) Schematic model of subcutaneous injection of the indicated tumor cells in vivo. (B, C) The effect of STOX1‐A overexpression or downexpression on the tumor weight (B) and volume (C) in the indicated mice group, including vector‐overexpression group (Vec‐OE), STOX1‐A overexpression group (STOX1A), vector‐shRNA group (Vec‐sh) and STOX1‐A overexpression group (sh#1). (D) H&E staining analysis of necrotic areas in the tumors from the indicated mice group (left panel). Analysis of necrotic areas in the indicated tumor tissues (right panel). n.s., no significant difference. (E, F) Analysis of Ki‐67 (E) and STOX1‐A (F) expression in the tumor tissues from the indicated mice group.
FIGURE 5
FIGURE 5
STOX1‐A promotes proliferation and growth of HCC cells by transcriptionally upregulating CCNB1. (A–D) The effect of STOX1‐A overexpression or downexpression on cell cycle progression of HCC cells, including G0/G1 phases (B), S phase (C) and G2/M phases (D), using flow cytometry. (E, F) Western blot analysis of the effect of STOX1‐A overexpression or downexpression on the expression of G1/S‐related regulatory proteins, including CDK2, CDK4, CDK6, cyclin D1 and cyclin E1, and G2/M‐related regulatory protein, including cyclin A1, cyclin B1 and CDK1. (G) Real‐time PCR analysis of the effect of STOX1‐A overexpression or downexpression on cyclin B1 expression. (H) Analysis of the effect of STOX1‐A overexpression or downexpression on the luciferase activity of cyclin B1 promoter using luciferase activity assay. * indicates p < 0.05.
FIGURE 6
FIGURE 6
STOX1‐A promotes proliferation and growth by ROS/PTEN/AKT1 pathway. (A) The effect of STOX1‐A overexpression or downexpression on intracellular production of ROS in HCC cells. *p < 0.05. (B) The effect of STOX1‐A overexpression or downexpression on mitochondrial membrane potential using mitochondrial membrane potential assay. *p < 0.05. (C) Western blot analysis of the effect of STOX1‐A overexpression or downexpression on the expression of oxygenizing and reduction PTEN, phosphorylated AKT1 (Ser473) and total AKT1. (D, E) The effect of AKT1 signaling inhibitor, Perofosine, (5 μmol/L) or H2O2 (100 μmol/L) on colony‐formation ability in the indicated HCC cells using colony‐formation assay. (F, G) The effect of Perofosine (5 μmol/L) (F) or H2O2 (100 μmol/L) (G) on colony‐formation ratio in the indicated HCC cells compared to the original levels using colony‐formation assay. *p < 0.05. (H) Western blot analysis of the effect of oxygen species absorber‐Pyrogallol or inhibitor‐GSK2795039 on the expression of oxygenizing PTEN, total PTEN, phosphorylated AKT1 (Ser473) and total AKT1 in the indicated HCC cells.
FIGURE 7
FIGURE 7
Clinical correlation of STOX1‐A expression with cyclin B1 and p‐AKT (Ser473) in clinical HCC samples. (A) Analysis of clinical correlation of STOX1‐A expression with cyclin B1 and p‐AKT (Ser473) in clinical HCC samples using immunohistochemical (IHC) staining. Upper panel: 4× magnification, scale bar, 200 μm; lower panel: 20× magnification, scale bar, 50 μm. (B, C) Statistical analysis of STOX1‐A expression with cyclin B1 (B) and p‐AKT (Ser473) (C) expression in clinical HCC samples. *p < 0.05.

Similar articles

References

    1. Llovet J. M. and Bruix J., “Molecular Targeted Therapies in Hepatocellular Carcinoma,” Hepatology 48 (2008): 1312–1327. - PMC - PubMed
    1. Bray F., Ferlay J., Soerjomataram I., Siegel R. L., Torre L. A., and Jemal A., “Global Cancer Statistics 2018: GLOBOCAN Estimates of Incidence and Mortality Worldwide for 36 Cancers in 185 Countries,” CA: A Cancer Journal for Clinicians 68, no. 6 (2018): 394–424. - PubMed
    1. White D. L., Thrift A. P., Kanwal F., Davila J., and El‐Serag H. B., “Incidence of Hepatocellular Carcinoma in All 50 United States, From 2000 Through 2012,” Gastroenterology 152 (2017): 812–820. - PMC - PubMed
    1. Llovet J. M., Kelley R. K., Villanueva A., et al., “Hepatocellular Carcinoma,” Nature Reviews. Disease Primers 7 (2021): 6. - PubMed
    1. Jiang Y., Han Q. J., and Zhang J., “Hepatocellular Carcinoma: Mechanisms of Progression and Immunotherapy,” World Journal of Gastroenterology 25 (2019): 3151–3167. - PMC - PubMed

MeSH terms