

Reliability of transcranial magnetic stimulation evoked potentials to detect the effects of theta-burst stimulation of the prefrontal cortex
- PMID: 40567304
- PMCID: PMC12172890
- DOI: 10.1016/j.ynirp.2022.100115
Reliability of transcranial magnetic stimulation evoked potentials to detect the effects of theta-burst stimulation of the prefrontal cortex
Abstract
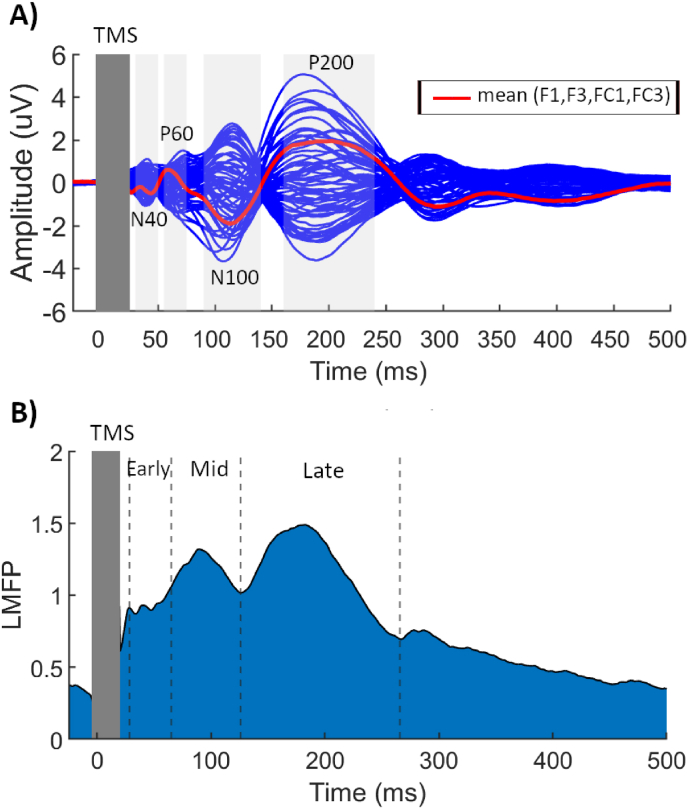
Background: Transcranial magnetic stimulation (TMS) with simultaneous electroencephalography (EEG) is a novel method for assessing cortical properties outside the motor region. Theta burst stimulation (TBS), a form of repetitive TMS, can non-invasively modulate cortical excitability and has been increasingly used to treat psychiatric disorders by targetting the dorsolateral prefrontal cortex (DLPFC). The TMS-evoked potentials (TEPs) and local mean field power (LMFP) analyses have been used to evaluate local cortical excitability changes after TBS. However, it remains unclear whether TEPs can detect the neuromodulatory effects of TBS.
Objectives: To confirm the reliability of TEP components and LMFP within and between sessions and to measure changes in neural excitability induced by intermittent (iTBS) and continuous TBS (cTBS) applied to the left DLPFC.
Methods: Test-retest reliability of TEPs/LMFP and TBS-induced changes in cortical excitability were assessed in twenty-four healthy participants by stimulating the DLPFC in five separate sessions, once with sham and twice with iTBS and cTBS. EEG responses were recorded of 100 single TMS pulses before and after TBS, and the reproducibility measures were quantified with the concordance correlation coefficient (CCC).
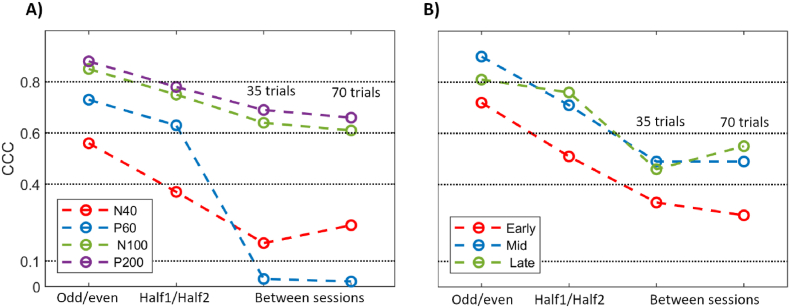
Results: The N100 and P200 components presented substantial reliability within the baseline block (CCCs>0.8) and moderate concordance between sessions (CCCmax> 0.6). Both N40 and P60 TEP amplitudes showed little concordance between sessions. Similar results were achieved using LMFP responses. Changes in TEP amplitudes after iTBS were marginally reliable for N100 (CCCmax = 0.52), P200 (CCCmax = 0.47) and P60 (CCCmax = 0.40), presenting only fair levels of concordance at specific time points. LMFP changes showed poor reproducibility after iTBS and cTBS.
Conclusions: The present findings show that only the N100 and P200 components had good concordance between sessions. The reliability of earlier TEP components and LMF responses may have been affected by a sub-optimal removal of TMS-related artefacts. The poor reliability in detecting changes in neural excitability induced by TBS indicates that TEPs/LMFP do not provide a precise estimate of the changes in excitability in the DLPFC or, alternatively, that TBS did not induce consistent changes in neural excitability.
Keywords: Dorsolateral prefrontal cortex; Electroencephalography; Test-retest reliability; Theta burst stimulation; Transcranial magnetic stimulation-evoked potentials.
© 2022 The Author(s).
Conflict of interest statement
A.H. Moffa has received a Scientia PhD Scholarship from the University of New South Wales, Sydney, Australia (2017–2021) and support through an “Government Research Training Program Scholarship”. There are no other conflicts.
Figures


Similar articles
-
Enhancing prefrontal modulation by phase-locking intermittent theta burst stimulation to a concurrent transcranial alternating current stimulation.Imaging Neurosci (Camb). 2025 Jan 3;3:imag_a_00415. doi: 10.1162/imag_a_00415. eCollection 2025 Jan 3. Imaging Neurosci (Camb). 2025. PMID: 40433300 Free PMC article.
-
Investigating the neural and behavioral correlates of the stress-rumination link in healthy humans by modulating the left Dorsolateral Prefrontal Cortex using Theta Burst Stimulation.Cogn Affect Behav Neurosci. 2025 Jun 23. doi: 10.3758/s13415-025-01305-0. Online ahead of print. Cogn Affect Behav Neurosci. 2025. PMID: 40551055
-
Characterising the contribution of auditory and somatosensory inputs to TMS-evoked potentials following stimulation of prefrontal, premotor, and parietal cortex.Imaging Neurosci (Camb). 2024 Nov 1;2:imag-2-00349. doi: 10.1162/imag_a_00349. eCollection 2024. Imaging Neurosci (Camb). 2024. PMID: 40800374 Free PMC article.
-
Theta burst stimulation for depression: a systematic review and network and pairwise meta-analysis.Mol Psychiatry. 2024 Dec;29(12):3893-3899. doi: 10.1038/s41380-024-02630-5. Epub 2024 Jun 6. Mol Psychiatry. 2024. PMID: 38844532 Free PMC article.
-
The use of theta burst stimulation in patients with schizophrenia - A systematic review.Schizophr Res. 2023 Nov;261:245-255. doi: 10.1016/j.schres.2023.10.005. Epub 2023 Oct 14. Schizophr Res. 2023. PMID: 37844414
References
-
- Antal A., Chaieb L., Moliadze V., Monte-Silva K., Poreisz C., Thirugnanasambandam N., Nitsche M.A., Shoukier M., Ludwig H., Paulus W. Brain-derived neurotrophic factor (BDNF) gene polymorphisms shape cortical plasticity in humans. Brain Stimul. 2010;3:230–237. - PubMed
-
- Bertazzoli G., Esposito R., Mutanen T.P., Ferrari C., Ilmoniemi R.J., Miniussi C., Bortoletto M. The impact of artifact removal approaches on TMS–EEG signal. Neuroimage. 2021;239:118272. - PubMed
-
- Biabani M., Fornito A., Mutanen T.P., Morrow J., Rogasch N.C. Characterizing and minimizing the contribution of sensory inputs to TMS-evoked potentials. Brain Stimul. 2019;12:1537–1552. - PubMed
-
- Cao K.-X., Ma M.-L., Wang C.-Z., Iqbal J., Si J.-J., Xue Y.-X., Yang J.-L.J.N. 2021. TMS-EEG: an Emerging Tool to Study the Neurophysiologic Biomarkers of Psychiatric Disorders; p. 108574. - PubMed
-
- Carrasco J.L., Phillips B.R., Puig-Martinez J., King T.S., Chinchilli V.M. Estimation of the concordance correlation coefficient for repeated measures using SAS and R. Comput. Methods Progr. Biomed. 2013;109:293–304. - PubMed
LinkOut - more resources
Full Text Sources
Miscellaneous