. 2023 Jul 20;3(3):100181.
doi: 10.1016/j.ynirp.2023.100181. eCollection 2023 Sep.

Classifying sex with volume-matched brain MRI

Affiliations

Classifying sex with volume-matched brain MRI

Matthis Ebel et al. Neuroimage Rep. .

Abstract

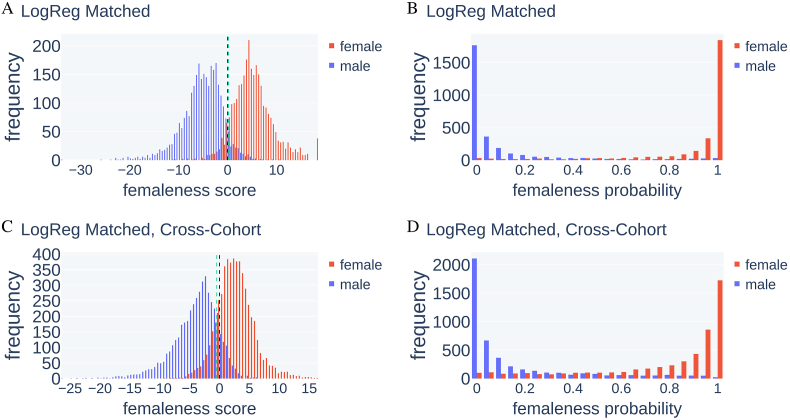
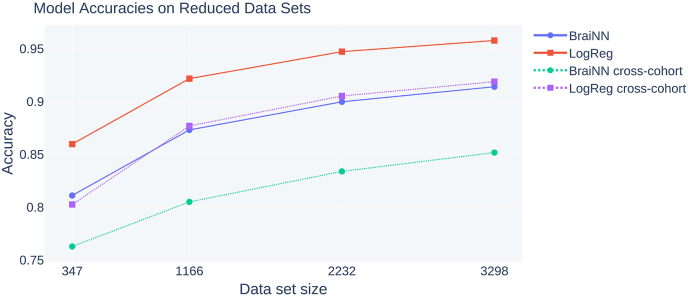
Sex differences in the size of specific brain structures have been extensively studied, but careful and reproducible statistical hypothesis testing to identify them produced overall small effect sizes and differences in brains of males and females. On the other hand, multivariate statistical or machine learning methods that analyze MR images of the whole brain have reported respectable accuracies for the task of distinguishing brains of males from brains of females. However, most existing studies lacked a careful control for brain volume differences between sexes and, if done, their accuracy often declined to 70% or below. This raises questions about the relevance of accuracies achieved without careful control of overall volume. We examined how accurately sex can be classified from gray matter properties of the human brain when matching on overall brain volume. We tested, how robust machine learning classifiers are when predicting cross-cohort, i.e. when they are used on a different cohort than they were trained on. Furthermore, we studied how their accuracy depends on the size of the training set and attempted to identify brain regions relevant for successful classification. MRI data was used from two population-based data sets of 3298 mostly older adults from the Study of Health in Pomerania (SHIP) and 399 mostly younger adults from the Human Connectome Project (HCP), respectively. We benchmarked two multivariate methods, logistic regression and a 3D convolutional neural network. We show that male and female brains of the same intracranial volume can be distinguished with >92% accuracy with logistic regression on a dataset of 1166 matched individuals. The same model also reached 85% accuracy on a different cohort without retraining. The accuracy for both methods increased with the training cohort size up to and beyond 3000 individuals, suggesting that classifiers trained on smaller cohorts likely have an accuracy disadvantage. We found no single outstanding brain region necessary for successful classification, but important features appear rather distributed across the brain.

Keywords: Convolutional neural network; Machine learning; Population based data; Sex discrimination; Voxel based morphometry.


Conflict of interest statement

The authors declare that they have no known competing financial interests or personal relationships that could have appeared to influence the work reported in this paper.

Figures

Fig. 1
Fig. 1
Data set properties age and TIV in male and female groups of both data sets. A) Age distribution in female and male samples in the SHIP data set. B) TIV distribution in female and male samples in the SHIP data set. C) Age distribution in female and male samples in the HCP data set. D) TIV distribution in female and male samples in the HCP data set.
Fig. 2
Fig. 2
Illustration of BraiNN's architecture. The layer dimensions are written above the layers, and the pooling and filter dimensions are written in orange. The first layer is the input image, a m = 113 × 137 × 113 voxel MRI scan with one gray value per voxel. It is followed by a 6 × 6 × 6 max pooling (same stride), resulting in a 18 × 22 × 18 layer. To the result, a 7 × 7 × 7 convolution with 32 filters is applied, resulting in a 32 × 12 × 16 × 12 layer. This is again max-pooled with 2 × 2 × 2 (stride ‘same’), resulting in a 32 × 6 × 8 × 6 layer. This is flattened and fully connected to a 128 unit dense layer (left arrow). A dropout layer (not shown) with rate 0.5 is applied before the final dense layer (right arrow). The last layer outputs a single unit – the femaleness probability. (For interpretation of the references to color in this figure legend, the reader is referred to the Web version of this article.)
Fig. 3
Fig. 3
Distribution of TIV (vol, in cm3) in female and male MR images in the volume-matched data set.
Fig. 4
Fig. 4
Receiver operating characteristic (ROC) curves for BraiNN and LogReg on the matched SHIP data set. The ROC curves of each single training run are shown in blue, the black curves are the respective averaged ROC curves. The mean area under the curve (AUC) is shown in the bottom right of the plots. A) ROC and AUC for BraiNN, trained on the matched SHIP data set when predicting the SHIP test data. B) ROC and AUC for BraiNN, trained on the matched SHIP data set when predicting the HCP data set. C) ROC and AUC for LogReg, trained on the matched SHIP data set when predicting the SHIP test data. D) ROC and AUC for LogReg, trained on the matched SHIP data set when predicting the HCP data set. (For interpretation of the references to color in this figure legend, the reader is referred to the Web version of this article.)
Fig. 5
Fig. 5
Distribution of femaleness score and femaleness probability from LogReg on SHIP test images and the HCP data set after training on the matched SHIP data set. A) Distribution of the femaleness score, red bars depict the frequency (y axis) of the score (x axis) for female scans, blue for male scans. A score below 0 (black dashed line) leads to classification of the image as male, otherwise as female. B) Distribution of the femaleness probability. Scans with a femaleness probability above 0.5 are classified as female. C) Distribution of the femaleness score when predicting on the HCP data set. D) Distribution of the femaleness probability when predicting on the HCP data set. The green dashed line is drawn at the decision threshold that maximizes classification accuracy. The optimal thresholds are near a score of 0 which is equivalent to a threshold of 50% femaleness probability. (For interpretation of the references to color in this figure legend, the reader is referred to the Web version of this article.)
Fig. 6
Fig. 6
Femaleness score vs. TIV of test images from BraiNN (A, B) and LogReg (C, D) on SHIP test images after training on the complete (A, C) or matched (B, D) SHIP data set. Red and blue dots represent individual MR images from women and men, respectively. In red and blue are the regression lines for the female and male samples, respectively. Pearson's correlation coefficients ρ for femaleness and TIV within sex and cohort are given in the legends, as well as the corresponding p-values from a two-sided Wald test. (For interpretation of the references to color in this figure legend, the reader is referred to the Web version of this article.)
Fig. 7
Fig. 7
Influence of the data set size (347, 1166, 2232 and 3298) on the model's AUC. The smaller sized data sets were randomly sampled from the complete (unmatched) cohort data set (3298) and training was performed as described in Section 2.5.
Fig. 8
Fig. 8
Regions that are important for sex discrimination with logistic regression on the matched data set. An increase in gray matter volume of voxels in red or yellow makes ‘woman’ more likely, an increase in gray matter volume of voxels in blue or green makes ‘man’ more likely. The color gradients red-to-yellow for women and blue-to-green for men give the repeatability among 25 training repetitions and are thresholded at 7. Cortical and subcortical regions have been overlayed on slices (left part); brain surface regions have been overlayed on a rendered brain (right part). For detection of a female brain thalamus, medial prefrontal lobe (mPFC), orbitofrontal cortex (OFC), inferior cerebellar hemisphere and the intraparietal sulcus showed highest importance. For the detection of a male brain amygdala, occipital pole and inferior temporal lobe showed highest importance. (For interpretation of the references to color in this figure legend, the reader is referred to the Web version of this article.)

References

    1. Abadi M., Agarwal A., Barham P., Brevdo E., Chen Z., Citro C., Corrado G.S., Davis A., Dean J., Devin M., Ghemawat S., Goodfellow I., Harp A., Irving G., Isard M., Jia Y., Jozefowicz R., Kaiser L., Kudlur M., Levenberg J., Mané D., Monga R., Moore S., Murray D., Olah C., Schuster M., Shlens J., Steiner B., Sutskever I., Talwar K., Tucker P., Vanhoucke V., Vasudevan V., Viégas F., Vinyals O., Warden P., Wattenberg M., Wicke M., Yu Y., Zheng X. TensorFlow: Large-Scale Machine Learning On Heterogeneous Systems. Software available from tensorflow.org. https://www.tensorflow.org/about/bib
    1. Anaya-Isaza A., Mera-Jiménez L., Verdugo-Alejo L., Sarasti L. Optimizing MRI-based brain tumor classification and detection using AI: a comparative analysis of neural networks, transfer learning, data augmentation, and the cross-transformer network. Eur. J. Radiol. Open. 2023;10 - PMC - PubMed
    1. Anderson N.E., Harenski K.A., Harenski C.L., Koenigs M.R., Decety J., Calhoun V.D., Kiehl K.A. Machine learning of brain gray matter differentiates sex in a large forensic sample. Hum. Brain Mapp. 2019;40(5):1496–1506. - PMC - PubMed
    1. Ashburner J., Friston K.J. Unified segmentation. Neuroimage. 2005;26(3):839–851. - PubMed
    1. Ashburner J., Friston K.J. Diffeomorphic registration using geodesic shooting and Gauss–Newton optimisation. Neuroimage. 2011;55(3):954–967. - PMC - PubMed

LinkOut - more resources