

Evaluating ultrastructural preservation quality in banked brain tissue
- PMID: 40567433
- PMCID: PMC12189018
- DOI: 10.17879/freeneuropathology-2025-6763
Evaluating ultrastructural preservation quality in banked brain tissue
Abstract
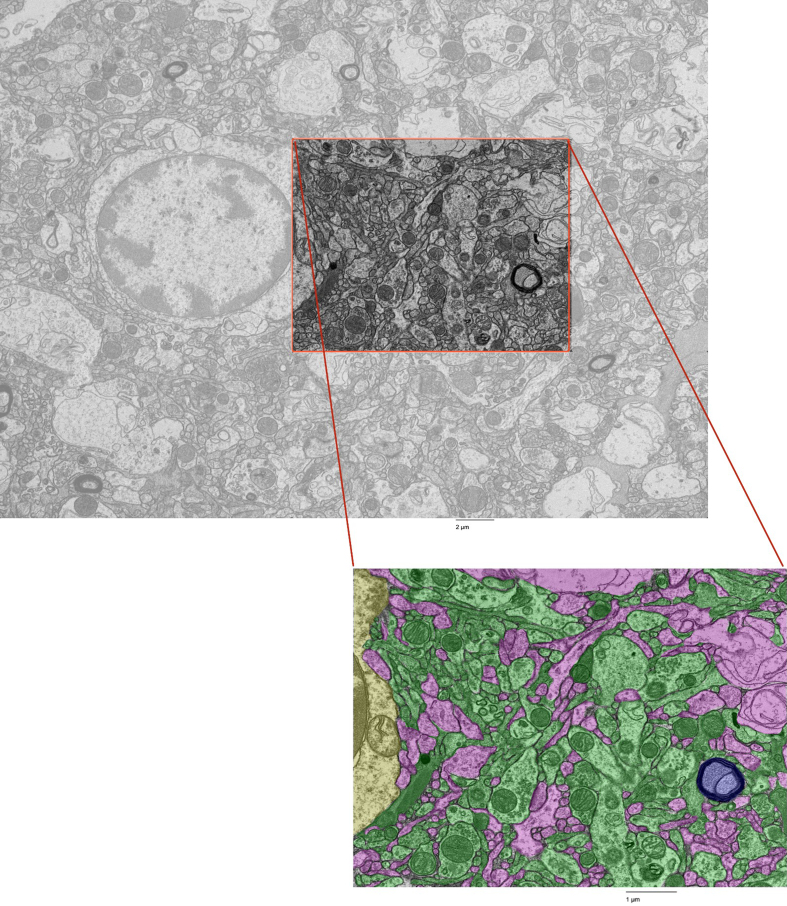
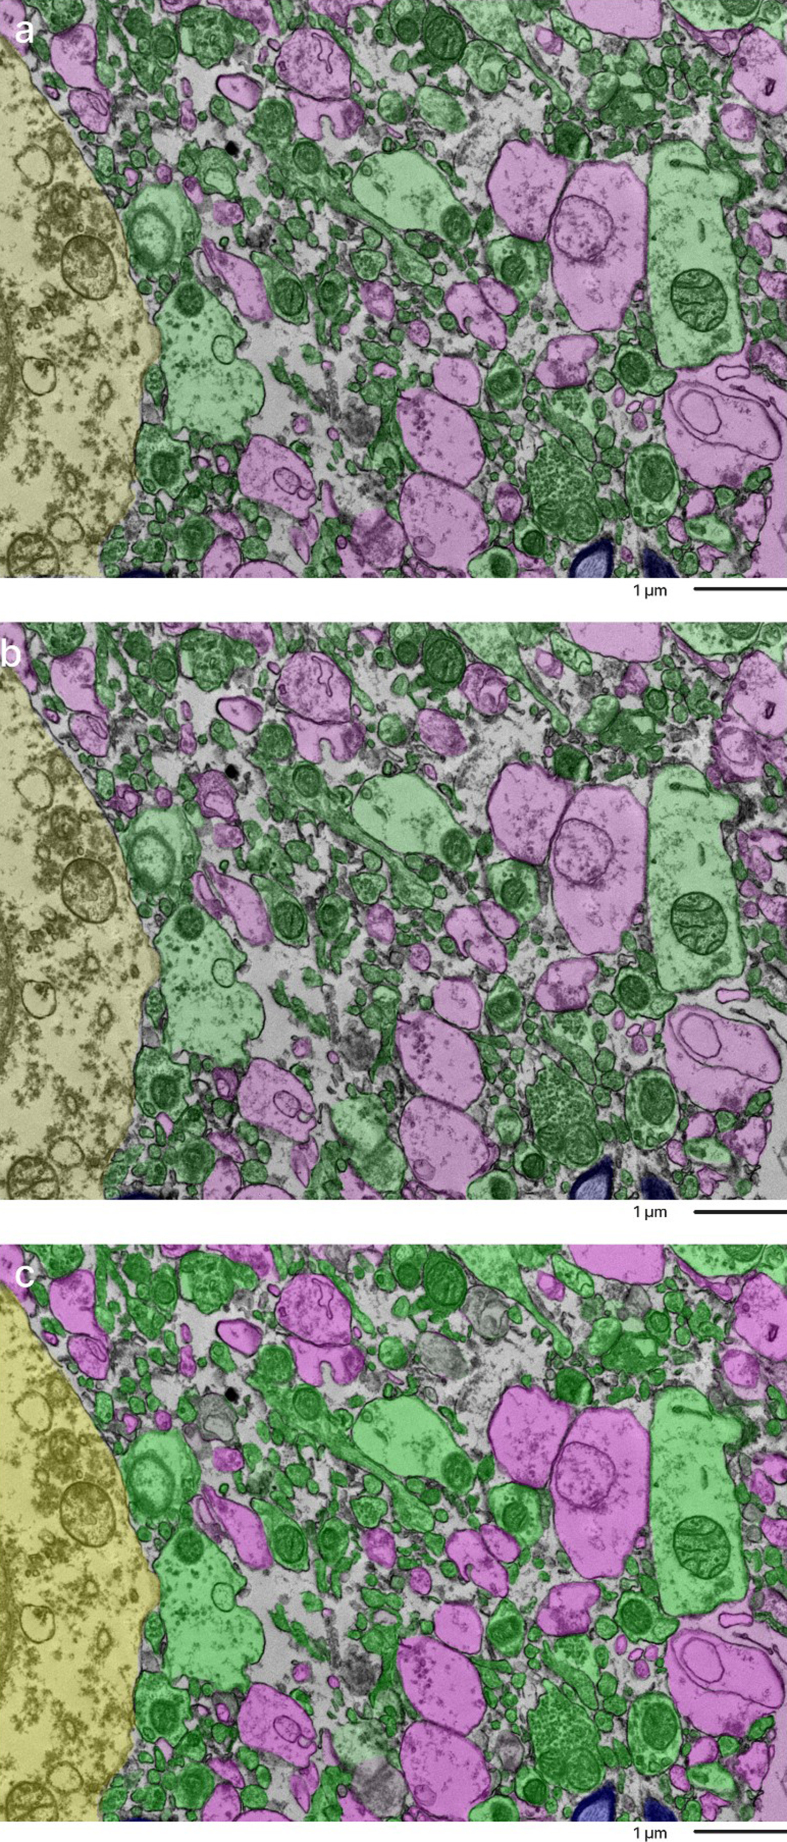
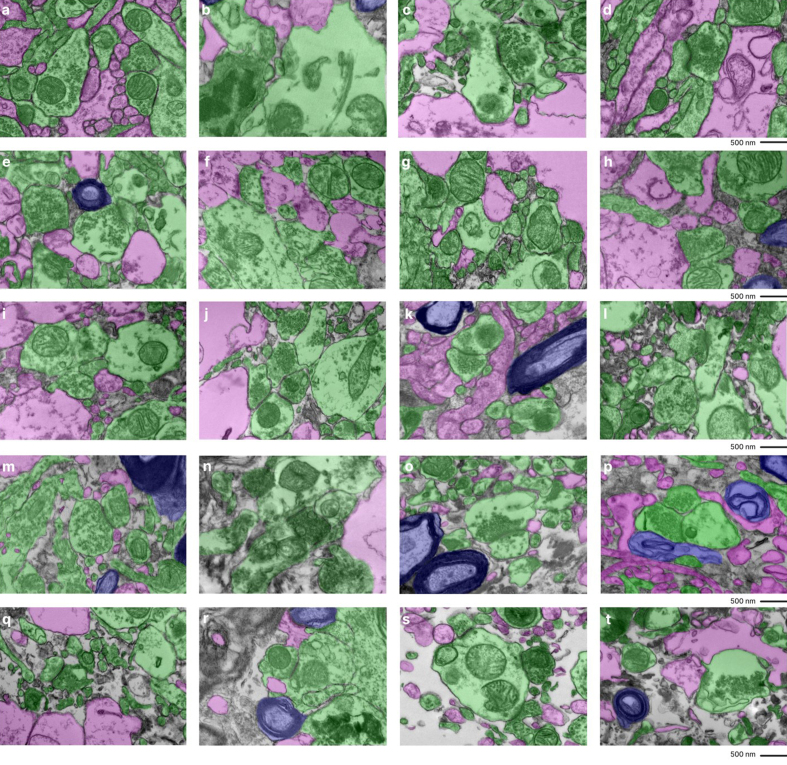
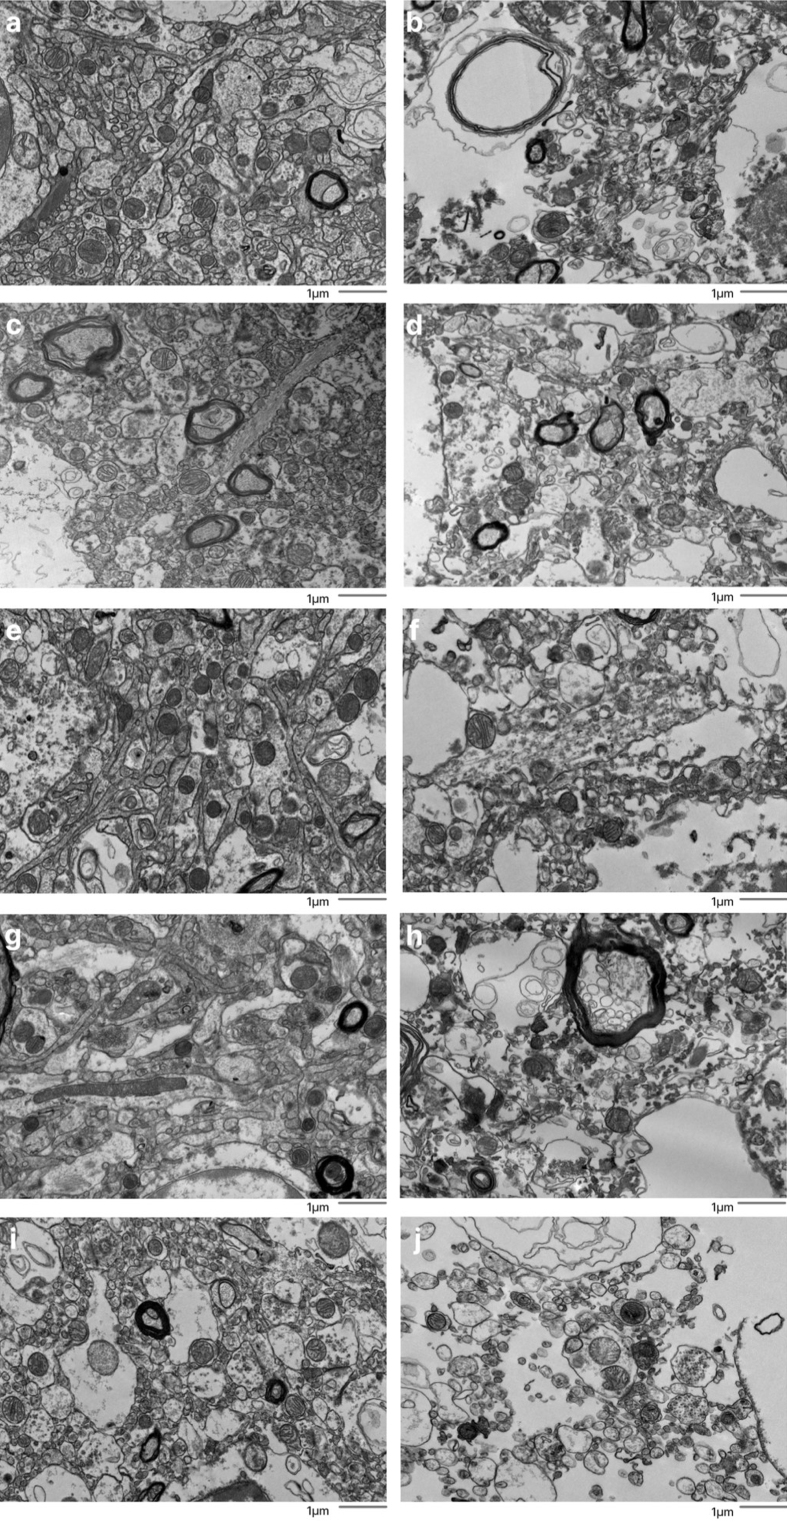
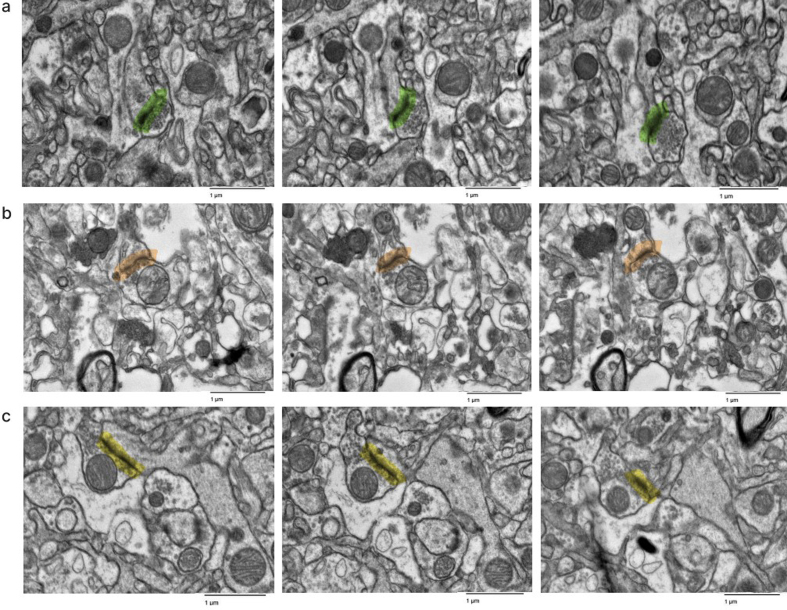
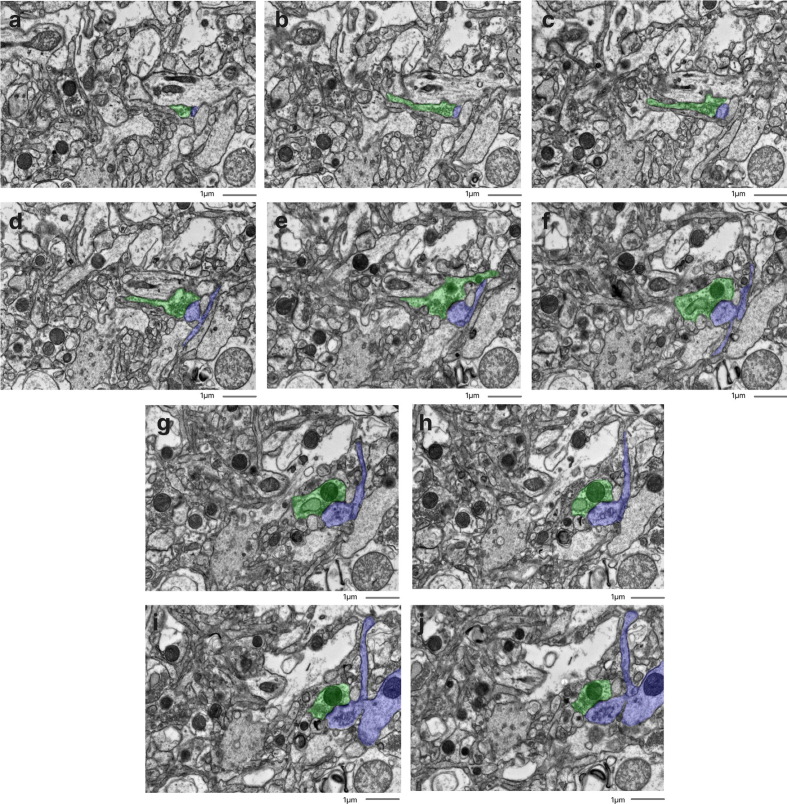
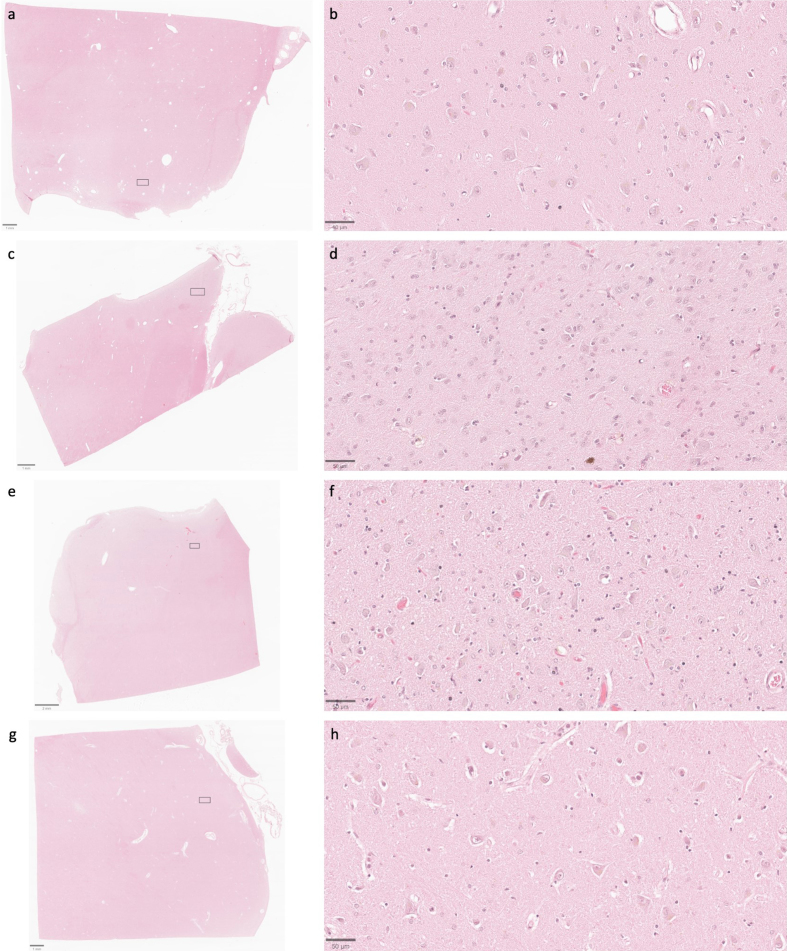
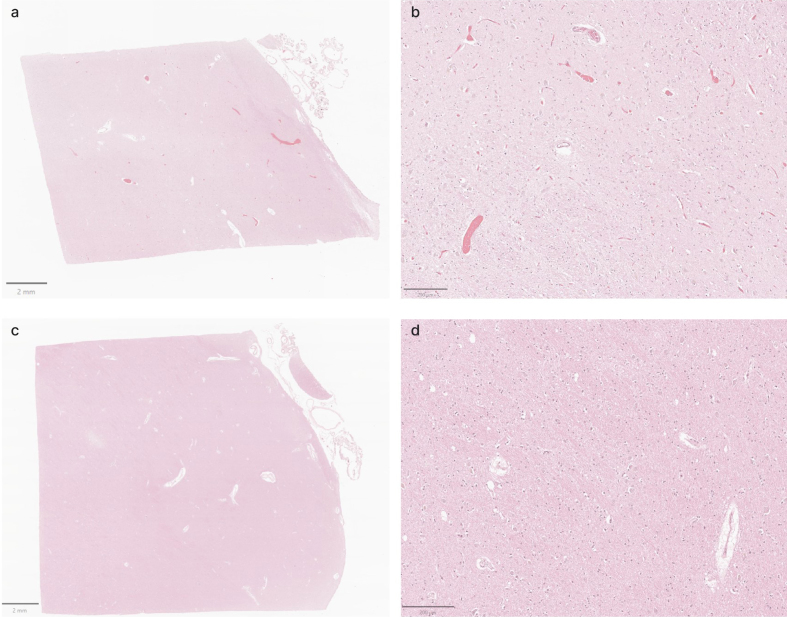
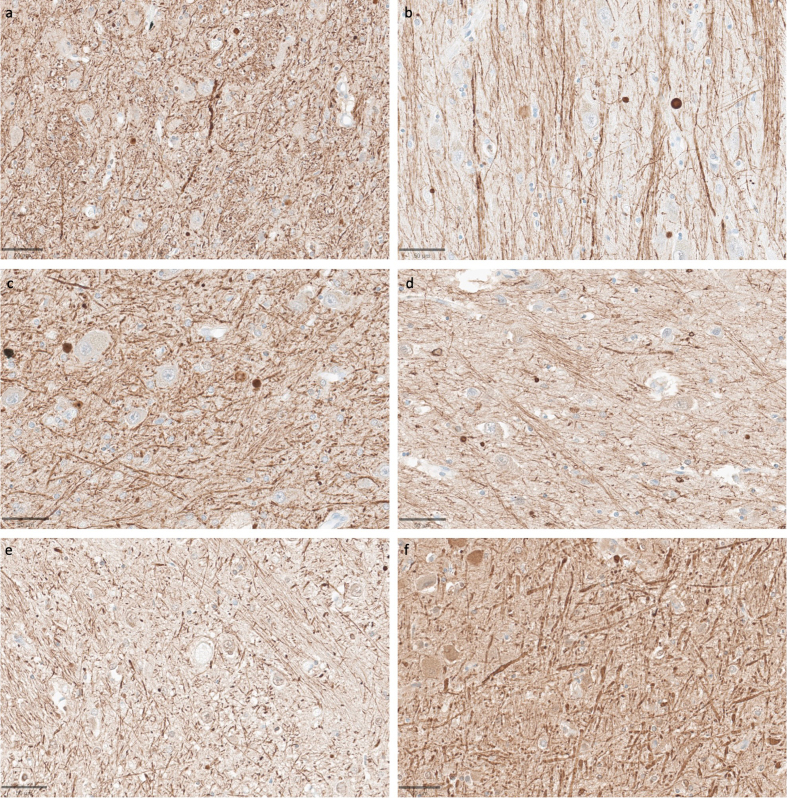
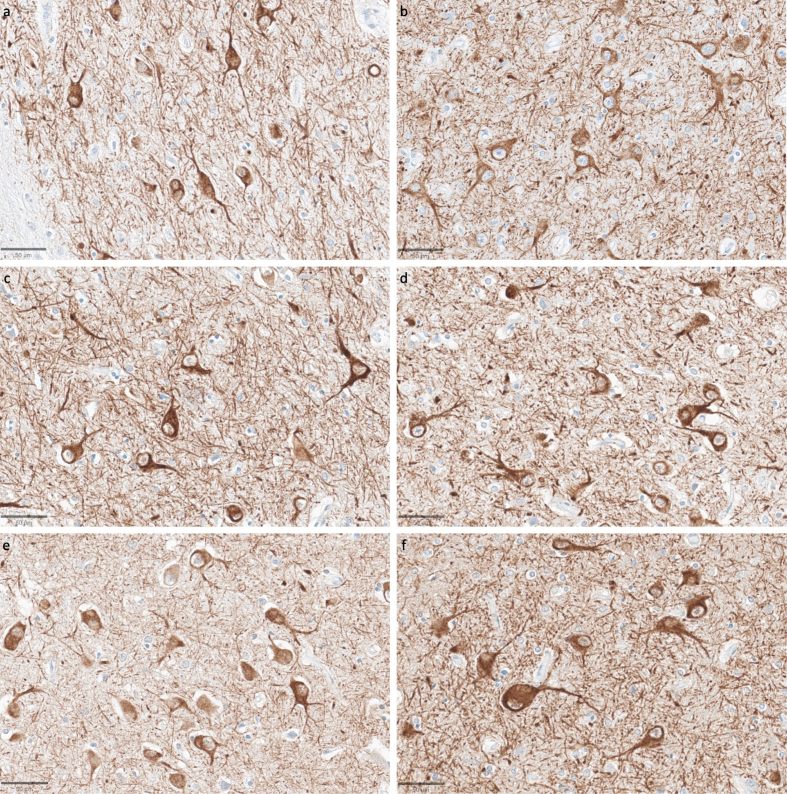
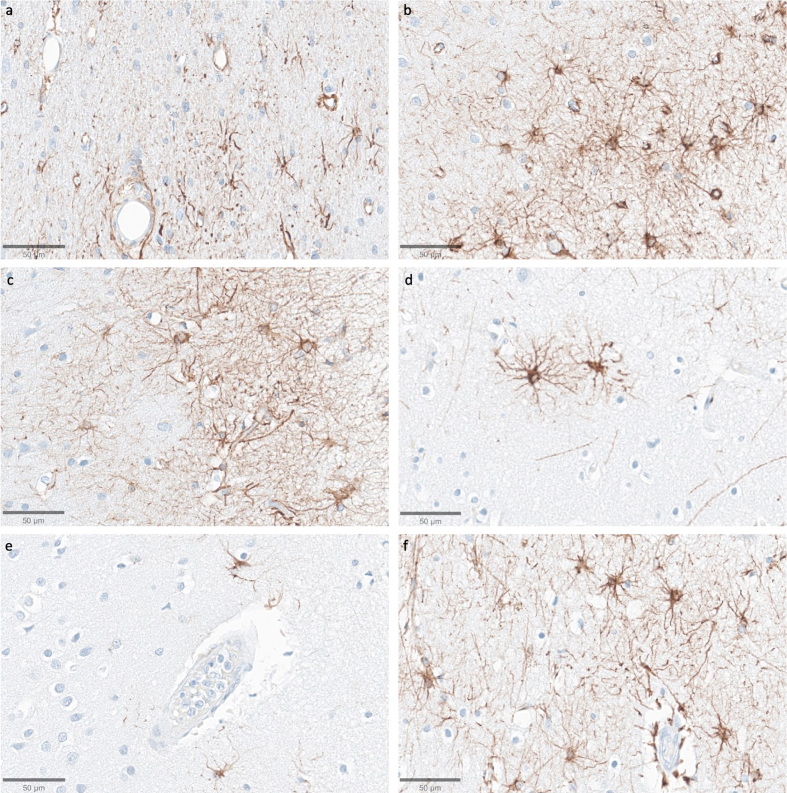
The ultrastructural analysis of postmortem brain tissue can provide important insights into cellular architecture and disease-related changes. For example, connectomics studies offer a powerful emerging approach for understanding neural circuit organization. However, electron microscopy (EM) data is difficult to interpret when the preservation quality is imperfect, which is common in brain banking and may render it unsuitable for certain research applications. One common issue is that EM images of postmortem brain tissue can have an expansion of regions that appear to be made up of extracellular space and / or degraded cellular material, which we call ambiguous interstitial zones. In this study, we report a method to assess whether EM images have ambiguous interstitial zone artifacts in a cohort of 10 postmortem brains with samples from each of the cortex and thalamus. Next, in matched samples from the contralateral hemisphere of the same brains, we evaluate the structural preservation quality of light microscopy images, including immunostaining for cytoskeletal proteins. Through this analysis, we show that on light microscopy, cell membrane morphology can be largely maintained, and neurite trajectory visualized over micrometer distances, even in specimens for which there are ambiguous interstitial zone artifacts on EM. Additionally, we demonstrate that synaptic structures can be successfully traced across serial EM sections in some postmortem samples, indicating the potential for connectivity studies in banked human brain tissue when appropriate preservation and visualization protocols are employed. Taken together, our analysis may assist in maximizing the usefulness of donated brain tissue by informing tissue selection and preparation protocols for various research goals.
Keywords: Brain banking; Connectomics; Neurofilaments; Perfusion fixation; Postmortem changes; Ultrastructural quality.
© 2025 The author(s).
Conflict of interest statement
Alicia Keberle, Macy Garrood, and Andrew McKenzie are employees of Oregon Brain Preservation, a non-profit brain preservation organization. Andrew McKenzie is a director of Apex Neuroscience, a non-profit research organization.
Figures
Update of
-
Evaluating ultrastructural preservation quality in banked brain tissue.bioRxiv [Preprint]. 2025 May 14:2025.05.09.652503. doi: 10.1101/2025.05.09.652503. bioRxiv. 2025. Update in: Free Neuropathol. 2025 Jun 25;6:13. doi: 10.17879/freeneuropathology-2025-6763. PMID: 40463251 Free PMC article. Updated. Preprint.
Similar articles
-
Evaluating ultrastructural preservation quality in banked brain tissue.bioRxiv [Preprint]. 2025 May 14:2025.05.09.652503. doi: 10.1101/2025.05.09.652503. bioRxiv. 2025. Update in: Free Neuropathol. 2025 Jun 25;6:13. doi: 10.17879/freeneuropathology-2025-6763. PMID: 40463251 Free PMC article. Updated. Preprint.
-
Assessing the comparative effects of interventions in COPD: a tutorial on network meta-analysis for clinicians.Respir Res. 2024 Dec 21;25(1):438. doi: 10.1186/s12931-024-03056-x. Respir Res. 2024. PMID: 39709425 Free PMC article. Review.
-
Comparison of cellulose, modified cellulose and synthetic membranes in the haemodialysis of patients with end-stage renal disease.Cochrane Database Syst Rev. 2001;(3):CD003234. doi: 10.1002/14651858.CD003234. Cochrane Database Syst Rev. 2001. Update in: Cochrane Database Syst Rev. 2005 Jul 20;(3):CD003234. doi: 10.1002/14651858.CD003234.pub2. PMID: 11687058 Updated.
-
Atypical antipsychotics for disruptive behaviour disorders in children and youths.Cochrane Database Syst Rev. 2017 Aug 9;8(8):CD008559. doi: 10.1002/14651858.CD008559.pub3. Cochrane Database Syst Rev. 2017. PMID: 28791693 Free PMC article.
-
Automated monitoring compared to standard care for the early detection of sepsis in critically ill patients.Cochrane Database Syst Rev. 2018 Jun 25;6(6):CD012404. doi: 10.1002/14651858.CD012404.pub2. Cochrane Database Syst Rev. 2018. PMID: 29938790 Free PMC article.
References
-
- Adams, J.H., Murray, M.F., 1982. Atlas of post-mortem techniques in neuropathology. Cambridge University Press. 10.1017/CBO9780511735479 - DOI
-
- Blair, J.A., Wang, C., Hernandez, D., Siedlak, S.L., Rodgers, M.S., Achar, R.K., Fahmy, L.M., Torres, S.L., Petersen, R.B., Zhu, X., Casadesus, G., Lee, H.G., 2016. Individual Case Analysis of Postmortem Interval Time on Brain Tissue Preservation. PloS one 11, e0151615. 10.1371/journal.pone.0151615 - DOI - PMC - PubMed
Grants and funding
LinkOut - more resources
Full Text Sources
Miscellaneous