

Assessment of localized brain regions correlated with MMSE using VBM analysis of structural MRI in a Japanese sample
- PMID: 40567454
- PMCID: PMC12172859
- DOI: 10.1016/j.ynirp.2025.100264
Assessment of localized brain regions correlated with MMSE using VBM analysis of structural MRI in a Japanese sample
Abstract
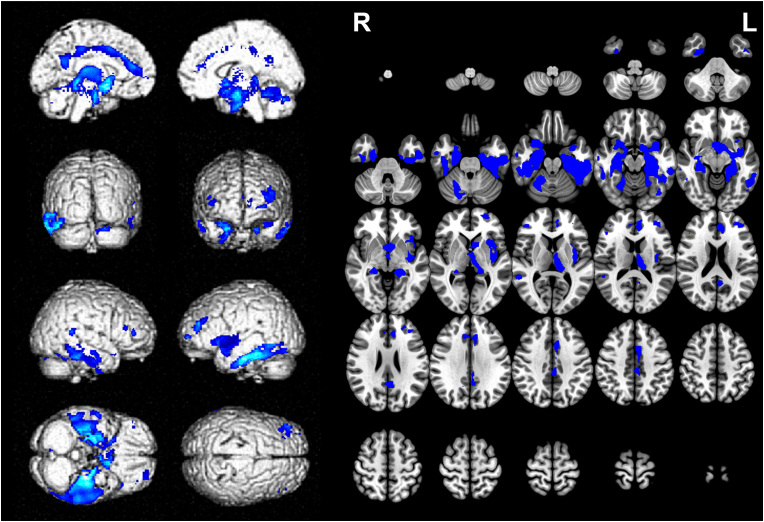
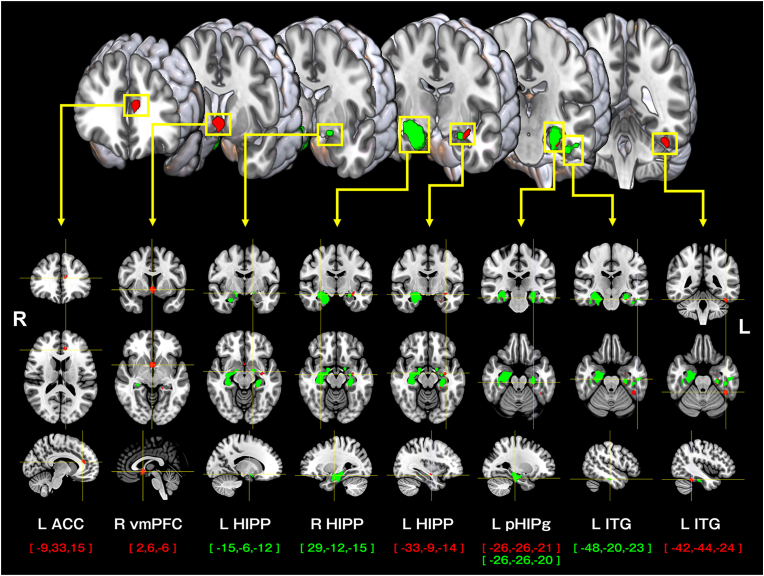
The global aging population has led to a significant rise in dementia and cognitive decline, with Alzheimer's disease as the primary cause. Early detection of mild cognitive impairment (MCI), a prodromal stage of dementia, is critical for timely intervention. The Mini-Mental State Examination (MMSE) is commonly used for cognitive screening, yet its limitations-such as ceiling effects and educational biases-may hinder the early identification of subtle cognitive impairments. This cross-sectional study employed voxel-based morphometry (VBM) analysis of structural magnetic resonance imaging (MRI) to explore brain regions positively correlated with MMSE scores in a cohort of 510 participants. Significant gray matter volume (GMV) reductions were observed in the bilateral lateral frontal lobes, left medial frontal lobe, left hippocampus, left anterior cingulate cortex (ACC), and bilateral inferior temporal gyri in association with lower MMSE scores. Participants were classified into three groups-Normal Cognition (NC), MCI, and Dementia (D)-based on MMSE cutoff values. Compared to the NC group, the MCI group exhibited significant GMV reductions in the left hippocampus, left parahippocampal gyrus, left ACC, and right ventromedial prefrontal cortex (vmPFC). The D group showed further GMV reductions in the bilateral hippocampus and left inferior temporal gyrus compared to the MCI group. These findings highlight the clinical utility of VBM-based structural MRI in assessing localized brain atrophy associated with cognitive decline, supporting its potential role in early diagnosis and intervention for MCI. Further research integrating longitudinal studies and multimodal biomarkers is warranted to enhance diagnostic accuracy.
Keywords: Dementia; Gray matter volume; Mild cognitive impairment; Mini-mental state examination; Normal cognition; Structural magnetic resonance image; Voxel-based morphometry.
© 2025 The Authors.
Conflict of interest statement
The authors have no conflicts of interest to declare.
Figures
Similar articles
-
Voxel-Based Morphometric Analysis of the Mini-Mental State Examination and the Mini-Mental State Examination-2 in Patients With Mild Cognitive Impairment and Alzheimer's Disease in Korea.J Korean Med Sci. 2025 Jul 28;40(29):e167. doi: 10.3346/jkms.2025.40.e167. J Korean Med Sci. 2025. PMID: 40726238 Free PMC article.
-
Voxel- and surface-based morphometry in the cortical thickness and cortical and subcortical gray matter volume in patients with mild-to-moderate Alzheimer's disease.Front Aging Neurosci. 2025 Jun 25;17:1546977. doi: 10.3389/fnagi.2025.1546977. eCollection 2025. Front Aging Neurosci. 2025. PMID: 40636899 Free PMC article.
-
Predicting cognitive decline: Deep-learning reveals subtle brain changes in pre-MCI stage.J Prev Alzheimers Dis. 2025 May;12(5):100079. doi: 10.1016/j.tjpad.2025.100079. Epub 2025 Feb 6. J Prev Alzheimers Dis. 2025. PMID: 39920001 Free PMC article.
-
Multi-domain interventions for the prevention of dementia and cognitive decline.Cochrane Database Syst Rev. 2021 Nov 8;11(11):CD013572. doi: 10.1002/14651858.CD013572.pub2. Cochrane Database Syst Rev. 2021. PMID: 34748207 Free PMC article.
-
Folic acid with or without vitamin B12 for cognition and dementia.Cochrane Database Syst Rev. 2003;(4):CD004514. doi: 10.1002/14651858.CD004514. Cochrane Database Syst Rev. 2003. Update in: Cochrane Database Syst Rev. 2008 Oct 08;(4):CD004514. doi: 10.1002/14651858.CD004514.pub2. PMID: 14584018 Updated.
References
LinkOut - more resources
Full Text Sources