Review
. 2025 Jun 24;16(27):12227-12241.
doi: 10.1039/d5sc03670d. eCollection 2025 Jul 10.

Structural determination of MCOFs: status, challenges and perspectives

Affiliations
Review

Structural determination of MCOFs: status, challenges and perspectives

A Boran et al. Chem Sci. .

Abstract

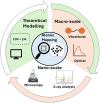
Porous materials have many promising characteristics, including tuneable chemical and optical properties, modifiable porosities and large surface areas. Long-range order frameworks have effective evaluation methods as a result of their crystallinities and in this context, nanoscale analysis, namely single-crystal X-ray diffraction, is a particularly useful approach for optimising the structure-property relationships. Metal-covalent organic frameworks (MCOFs), synthesised by incorporating a metal complex into a stable covalent organic framework (COF) backbone, have shown considerable promise for a variety of applications. Nonetheless, their wide-scale implementation remains hindered due to difficulties in structurally mapping them; their typically reduced crystallinities result in major challenges for their structural determination. By classifying MCOFs as metalated COFs (MeCOFs) and metalloligand COFs (MLCOFs), the characterisation of these lower crystallinity frameworks can be carried out according to their distinctive architecture using a combination of complementary structural analysis techniques. This perspective highlights examples of a synergistic approach to the structural elucidation of MLCOFs to overcome obstacles related to their crystalline nature, generating an atomic map through a combination of nano and macroscale characterisation procedures supported by theoretical modelling tools. The effective use of structural characterisation methods is considered in this perspective, which can reveal key information regarding the structure-activity relationships as they relate to MLCOFs.


Conflict of interest statement

There are no conflicts to declare.

Figures

Fig. 1
Fig. 1. Classification of MCOFs according to the formation requirements and structural definition.
Fig. 2
Fig. 2. (a) One-dimensional inorganic subunit of the metal oxide chain in MIL-140-14F. (b) Illustration of the crystal structure and pore chemistry of MIL-140-4F. (c and d) The Hirshfeld surface with de (electrostatic potential) and binding sites in CeIV- (c) and ZrIV-MIL-140-4F (d) (red-to-blue color indicates the high-to-low transition of electron density). (e) Experimental and simulated PXRD patterns of CeIV-MIL-140-4F. (f) Experimental (black) and Pawley refined (red) PXRD patterns of ZrIV-MIL-140-4F. Reproduced from ref. with permission from Wiley-VCH, copyright 2021.
Fig. 3
Fig. 3. Schematic structures of COF-SDU with different building units. Reproduced from ref. with permission from Elsevier, copyright 2019.
Fig. 4
Fig. 4. Design and synthesis of MeCOFs; pre- and post-synthetic approaches.
Fig. 5
Fig. 5. (a) Synthesis of sp2c-COFdpy and (b) sp2c-COFdpy-Co. (c) Schematic CO2 photoreduction on the as-prepared sp2c-COFdpy-Co. Reproduced from ref. with permission from Elsevier, copyright 2020.
Fig. 6
Fig. 6. Design and synthesis of MLCOFs.
Fig. 7
Fig. 7. (a) FT-IR spectrum of activated COF-505, (b) solid-state 13C-CP/MAS NMR spectrum of COF-505 and its molecular analogue and (c) schematic representation of COF-505. Reproduced from ref. with permission from AAAS, copyright 2016.
Fig. 8
Fig. 8. Intensity contour plots of the 1H NMR spectra recorded as a function of time in the in situ NMR study of MFM-500(Ni) synthesis, and individual spectra selected at specific times (indicated by horizontal dashed lines in the contour plots), at (a) 60 °C, (b) 70 °C, (c) 80 °C, (d) 90 °C and (e) 100 °C. Assignments of the three peaks due to aromatic 1H environments (denoted Ha, Hb and Hc) in the BTPPA linker are shown in (f). The spectra are shown without normalization. Reproduced from ref. with permission from RSC, copyright 2021.
Fig. 9
Fig. 9. PXRD patterns of (a) JNM-3-AA and (b) JNM-3-ABC with the experimental profiles in black, difference curve in light blue, and calculated profiles of AA (orange) and ABC (purple) packing modes. (Herein, the preferred orientation along with the (110) plane was considered in the calculated ABC model). Top (c) and side (e) views of the corresponding refined 2D crystal structure of JNM-3-AA. Top (d) and side (f) views of the corresponding refined 2D crystal structure of JNM-3-ABC. (g) The pore-size distribution profiles of JNM-3-AA calculated by nonlocal DFT modelling based on N2 adsorption data, showing a uniform pore size of 3.70 nm. (h) The N2 adsorption (filled) and desorption (open) isotherm profiles of JNM-3-AA and JNM-3-ABC at 77 K. Reproduced from ref. with permission from RSC, copyright 2021.
Fig. 10
Fig. 10. (a) SEM image of the film-like morphology of 2D-JNM-4. (b) Enlarged image of area in the white box in part a. (c) SEM image of JNM-4-Ns. Inset, Tyndall effect of JNM-4-Ns dispersion in EtOH. (d) Lateral size distribution histogram and Gaussian fit curve of JNM-4-Ns. (e) AFM image of JNM-4-Ns. (f) Corresponding height curves for the selective areas in part (e). (g) HR-TEM image of JNM-4-Ns. Inset, fast Fourier transform (FFT) image. (h) Enlarged image of selected area in part (g). (i) Simulated TEM image of JNM-4-Ns along the [100] direction. Reproduced with permission from ref. with permission from ACS, copyright 2022.
Fig. 11
Fig. 11. In situ VT-PXRD patterns from NU-906 to NU-1008 within DMF/formic acid (3 : 1) taken with a Cu Kα radiation source. Reproduced from ref. with permission from ASC, copyright 2020.
Fig. 12
Fig. 12. (a) Side and (b) top view of charge density difference after Ca binding onto benzene. Isosurfaces with values of ±0.005 e Å−3 are shown. Red and blue clouds correspond to electron depletion and accumulation, respectively. (c) Same as (b) but for both two Ca and 10H2 binding to benzene. (d) and (e) Same as (a) and (b) but for Ca binding on five-membered C5H5. (f) The H2 binding energy as a function of distance (z) between Ca and H2 on C5H5. Reproduced from ref. with permission from Nature Portfolio, copyright 2013.
Fig. 13
Fig. 13. Structure elucidation of MLCOFs, a synergetic approach.
Fig. 14
Fig. 14. The SEM (left), TEM (right) and HAADF-STEM with corresponding elemental mapping (bottom) images of (a) RuCOF-ETTA, (b) RuCOF-TPB and (c) RuCOF-ETTBA. The PXRD patterns of (d) RuCOF-ETTA, (e) RuCOF-TPB and (f) RuCOF-ETTBA: the experimental (red), Pawley refined(black), simulated (blue), and difference between experimental and refined (green). Insets: the structures, powders and unit cell parameters of corresponding RuCOFs. Reproduced from ref. with permission from Wiley-VCH, copyright 2022.
Fig. 15
Fig. 15. Scanning probe microscopies characterisation of the Ru-pyrene MCOF. (a) High-resolution STM image showing the Ru-pyrene MCOF imaged at the heptanoic acid/HOPG interface. The measured distances and angle between repeating units obtained from calibrated STM images are: a = 1.7 ± 0.1 nm; b = 1.8 ± 0.1 nm; γ = 80 ± 3°. Imaging parameters: Vbias = −0.4 V, Iset = 150 pA. (b) Molecular models of the Ru-pyrene MCOF and Ru-metalloligand 3 (inset). Relevant intramolecular and intralayer distances between Ru atoms are given in nm. The STM pattern is overlaid in grey. (c) AFM image showing the layered morphology of the Ru-pyrene MCOF. (d) Line profile across one of the islands in (c) showing the step height of ca. 0.6 nm. Reproduced from ref. with permission from Wiley-VCH, copyright 2025.
Fig. 16
Fig. 16. (a) Representation of the (3,6)-connected eea and spn topologies, which were deconstructed into trigonal antiprismatic and planar triangle linkers with their corresponding chemical equivalents Na2Ti(2,3-DHTA)3 and TAPT. (b) The experimental (black) and Pawley refined (red) PXRD patterns of TiCOF-spn, the difference between the experimental and refined PXRD patterns (green), and the simulated PXRD patterns based on eea net (purple) and spn net (blue). (c) The 2D scattering image of TiCOF-spn was reduced to 1D data. (d) The PDF data and calculated PDF pattern with spn net for TiCOF-spn. Reproduced from ref. with permission from Elsevier, copyright 2022.

References

    1. Ding S.-Y. Wang W. Chem. Soc. Rev. 2013;42:548–568. doi: 10.1039/C2CS35072F. - DOI - PubMed
    1. Chen R. Zhang J. Chelora J. Xiong Y. V Kershaw S. Li K. F. Lo P.-K. Cheah K. W. Rogach A. L. Zapien J. A. Lee C.-S. ACS Appl. Mater. Interfaces. 2017;9:5699–5708. doi: 10.1021/acsami.6b12469. - DOI - PubMed
    1. Qian Y. Zhang F. Pang H. Adv. Funct. Mater. 2021;31:2104231. doi: 10.1002/adfm.202104231. - DOI
    1. Li Y. Karimi M. Gong Y.-N. Dai N. Safarifard V. Jiang H.-L. Matter. 2021;4:2230–2265. doi: 10.1016/j.matt.2021.03.022. - DOI
    1. Feng L. Wang K.-Y. Day G. S. Ryder M. R. Zhou H.-C. Chem. Rev. 2020;120:13087–13133. doi: 10.1021/acs.chemrev.0c00722. - DOI - PubMed

LinkOut - more resources