. 2025 Jun 11:15:1577283.
doi: 10.3389/fonc.2025.1577283. eCollection 2025.

Stemness-driven clusters in ovarian cancer: immune characteristics and prognostic implications

Affiliations

Stemness-driven clusters in ovarian cancer: immune characteristics and prognostic implications

Xinyan Zeng et al. Front Oncol. .

Abstract

Background: Ovarian cancer (OC) is the most common malignant gynecological tumor. Cancer cells with high stemness often exhibit resistance to anti-tumor therapies, contributing to recurrence and poor prognosis. However, stemness-related subtypes in OC and their therapeutic implications remain underexplored.

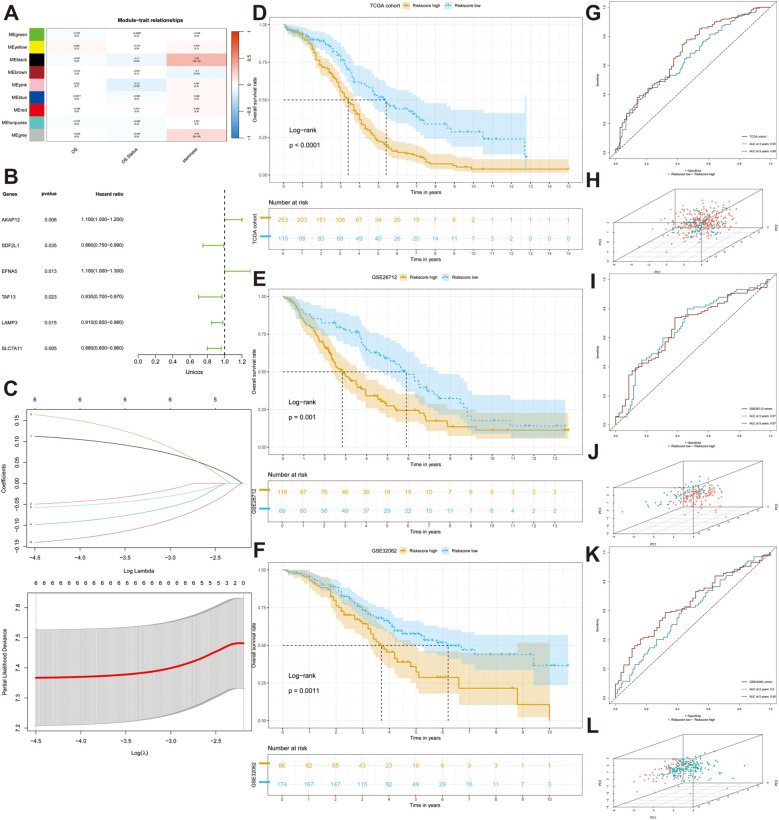
Methods: We identified stemness-associated genes by comparing transcriptome profiles between adherent and sphere-forming SKOV3 cells. Unsupervised clustering was applied to define stemness-related molecular subgroups in OC patients. A prognostic model was constructed using WGCNA and LASSO regression, and a nomogram was developed by integrating clinicopathological variables. Differences in the tumor microenvironment (TME), tumor mutation burden (TMB), immune checkpoint expression, and drug sensitivities were evaluated between risk groups. Single-cell RNA sequencing was used to investigate stemness-related cell types. Functional assays were conducted to validate the role of AKAP12 in OC progression.

Results: Three distinct stemness-related subgroups were identified with significant differences in prognosis and immunological features. Fibroblasts were identified as major contributors to the maintenance of stemness traits in the TME. AKAP12 was found to be positively associated with stemness phenotypes. Knockdown of AKAP12 reduced tumor sphere formation, impaired cell migration, and enhanced cisplatin sensitivity. Immunohistochemistry in clinical samples and OC organoids confirmed the correlation between AKAP12 and the immune checkpoint molecule OX40L.

Conclusion: This study establishes a novel stemness-related gene signature for prognosis prediction and therapeutic stratification in OC. AKAP12 was identified as a potential biomarker and therapeutic target, offering new avenues for precision treatment in stemness-driven OC.

Keywords: drug resistance; immune checkpoints; ovarian cancer; stemness; tumor organoid.


Conflict of interest statement

The authors declare that the research was conducted in the absence of any commercial or financial relationships that could be construed as a potential conflict of interest.

Figures

Figure 1
Figure 1
A schematic flow of the whole study.
Figure 2
Figure 2
Distinguishing distinct stem subgroups and delineating correlated characteristics in The Cancer Genome Atlas Program (TCGA) cohort. (A) The expression profiles of different stem genes in three stem sub clusters. (B) The consensus matrix for ovarian cancer (OC) samples when k = 3. (C) Kaplan-Meier (KM) curves manifest the survival discrepancy among three groups. (D, E) The distribution of diverse immune cells and the expression of immune checkpoints among different groups. (F–I) Box plots display the distribution of estimate scores, immune scores, stromal scores and tumor purity among three clusters. ns, not significant, *p < 0.05, **p < 0.01, ***p < 0.001, ****p < 0.0001.
Figure 3
Figure 3
Construction and validation of a stem gene signature. (A) A heatmap depicts the correlation and the confidence coefficients between each indicator and nine generated modules utilizing weighted correlation network analysis (WGCNA). (B) A forest plot depicts the prognostic value of all stem genes calculated by univariate Cox analysis. (C) Selection for six desirable prognostic genes to construct prognostic model based on the optimal parameter λ utilizing Least absolute shrinkage and selection operator (Lasso) Cox regression. (D–F) KM analyses are performed in three datasets (TCGA-OV, GSE26712, GSE32062). (G, I, K) ROC curves illustrated the sensitivity and specificity of the models. (H, J, L) Three-dimensional Principal Component Analysis (PCA) diagrams displaying the distribution of samples.
Figure 4
Figure 4
Establishing a nomogram based on risk score and clinical variables for predicting the 3-year and 5-year survival probability in TCGA cohort. (A, B) Univariable and multiple Cox regression for identifying independent predictive factors. (C) A nomogram for predicting overall survival (OS). (D, E) Calibration plots for predicting 3-year and 5-year OS. (F) Comparing the concordance indexes (C-indexes) of nomogram, risk score, race and age. (G) Distribution Curve Analysis (DCA) analysis of diverse indicators.
Figure 5
Figure 5
Investigating the difference in terms of tumor microenvironment (TME) between high- and low-groups. (A, B) The difference of the expression of immune checkpoints and immune functions between two groups. (C, D) Waterfall diagrams reveal the landscape of TMB in high-risk (N = 189) and low-risk (N = 83) groups. (E) A box plot suggests high-risk group had lower mutations. (F) KM analysis demonstrates the different OS between two risk groups. ns, not significant, *p < 0.05, **p < 0.01, ***p < 0.001.
Figure 6
Figure 6
Single-cell analysis reveals the potential mechanisms of stem genes in remodeling TME. (A) The overall single-cell landscape of ovarian samples depicted by the uniform manifold approximation and projection (UMAP). (B) Distributions of stemness signature score in all cell types depicting by violin plot. (C–E) The enrichment extent of AKAP12, EFNA5 and SLC7A11 in all cell types. (F) The strength and activation of stem signals among different cell clusters. (G) Cell-cell communication analysis illustrating the interactions and weights of inter-cellular signals. (H) A heatmap showing the potential roles of all cell types in COLLAGEN signaling pathway. (I) The strength of outgoing and incoming signaling patterns among all cell types manifested by a heatmap. ns, not significant, **p < 0.01, ****p < 0.0001.
Figure 7
Figure 7
Effects of AKAP12 knockdown on stemness, migration, and chemosensitivity in ovarian cancer cells, and expression analysis in clinical samples and organoids. (A) Relative expression levels of classical stemness markers (OCT4, SOX2, CD133) and AKAP12 in SKOV3 cells cultured under adherent versus tumor sphere-forming conditions, assessed by qRT-PCR. (n = 3). (B) Verification of AKAP12 knockdown efficiency in SKOV3 cells by qRT-PCR. (n = 3). (C) Cell viability curves and IC50 values for cisplatin in scramble- and siAKAP12-transfected SKOV3 cells, assessed by CCK-8 assay. (n = 3). (D) Representative tumor sphere images showing the morphological differences between scramble and siAKAP12-transfected SKOV3 cells after 3 days of culture. (E) Quantitative analysis of sphere formation efficiency in scramble and siAKAP12 groups. (n = 3). (F) Representative Transwell images showing the migrated SKOV3 cells after AKAP12 knockdown compared to scramble controls. (n = 3). (G) Quantification of migrated cell numbers per field in scramble and siAKAP12-transfected SKOV3 cells. (n = 3). (H) Representative immunohistochemical images showing differential expression of AKAP12 and OX40L in four ovarian cancer tissue samples. (I) Quantitative comparison of staining intensity between high- and low-expression subgroups. (J) Expression levels of AKAP12 and OX40L in ovarian cancer organoids. Data are presented as mean ± SEM. *p < 0.05, **p < 0.01, ***p < 0.001, ****p < 0.0001.

Similar articles

References

    1. Webb PM, Jordan SJ. Global epidemiology of epithelial ovarian cancer. Nat Rev Clin Oncol. (2024) 21:389–400. doi: 10.1038/s41571-024-00881-3 - DOI - PubMed
    1. Stewart C, Ralyea C, Lockwood S. Ovarian cancer: an integrated review. Semin Oncol nursing. (2019) 35:151–6. doi: 10.1016/j.soncn.2019.02.001 - DOI - PubMed
    1. Hao Q, Li J, Zhang Q, Xu F, Xie B, Lu H, et al. Single-cell transcriptomes reveal heterogeneity of high-grade serous ovarian carcinoma. Clin Trans Med. (2021) 11:e500. doi: 10.1002/ctm2.v11.8 - DOI - PMC - PubMed
    1. Xu J, Fang Y, Chen K, Li S, Tang S, Ren Y, et al. Single-cell RNA sequencing reveals the tissue architecture in human high-grade serous ovarian cancer. Clin Cancer research: an Off J Am Assoc Cancer Res. (2022) 28:3590–602. doi: 10.1158/1078-0432.CCR-22-0296 - DOI - PMC - PubMed
    1. Veneziani AC, Gonzalez-Ochoa E, Alqaisi H, Madariaga A, Bhat G, Rouzbahman M, et al. Heterogeneity and treatment landscape of ovarian carcinoma. Nat Rev Clin Oncol. (2023) 20:820–42. doi: 10.1038/s41571-023-00819-1 - DOI - PubMed

LinkOut - more resources