. 2025 Apr 24:11:e2784.
doi: 10.7717/peerj-cs.2784. eCollection 2025.

Early detection and analysis of accurate breast cancer for improved diagnosis using deep supervised learning for enhanced patient outcomes

Affiliations

Early detection and analysis of accurate breast cancer for improved diagnosis using deep supervised learning for enhanced patient outcomes

Mandika Chetry et al. PeerJ Comput Sci. .

Abstract

Early detection of breast cancer (BC) is essential for effective treatment and improved prognosis. This study compares the performance of various machine learning (ML) algorithms, including convolutional neural networks (CNNs), logistic regression (LR), support vector machines (SVMs), and Gaussian naive Bayes (GNB), on two key datasets, Wisconsin Diagnostic Breast Cancer (WDBC) and Breast Cancer Histopathological Image Classification (BreaKHis). For the BreaKHis dataset, the CNN achieved an impressive accuracy of 92%, with precision, recall, and F1 score values of 91%, 93%, and 91%, respectively. In contrast, LR achieved 88% accuracy, with corresponding precision, recall, and F1 score values of 86%, 87%, and 89%, respectively. SVM and GNB demonstrated 90% and 84% accuracy, respectively, with similar precision, recall, and F1-score metric performances. In the WDBC dataset, LR achieved the highest accuracy of 97.5%, with nearly 97% values for precision, recall, and F1 score. In contrast, CNN attained 96% accuracy with equal recall, precision, and F1 score values of 96%. SVM and GNB followed closely with 95% and 94% accuracy, respectively. Minimising the false negative rate (FNR) and false omission rate (FOR) is vital for improving model reliability, with the LR excelling in the WDBC dataset (FNR: 5.9%, FOR: 4.8%) and the CNN performing best in the BreaKHis dataset (FNR: 8.3%, FOR: 7.0%). The results demonstrate that CNN outperforms traditional models across both datasets, highlighting its potential for early and accurate BC detection.

Keywords: AI; BreaKHis; Breast cancer; Cancer diagnosis; Convolutional neural network; Deep learning; Deep supervised learning; Image classification; Logistic regression; WDBC.


Conflict of interest statement

The authors declare that they have no competing interests.

Figures

Figure 1
Figure 1. Overview of the applied hypothesis and its implementation process in the research workflow.
The progression from hypothesis formation to result integration, highlighting key steps, including data collection, computational modeling, and validation methods.
Figure 2
Figure 2. Breast cancer detection strategies highlight advanced computational and diagnostic approaches.
Key strategies for breast cancer detection, including imaging techniques, biomarker analysis, and computational methods such as machine learning and deep learning models. The integration of these approaches enhances diagnostic accuracy and early detection.
Figure 3
Figure 3. Traditional screening methods for cancer detection, emphasizing conventional diagnostic approaches.
Established methods for cancer detection, including physical examinations, mammography, biopsy, and ultrasound imaging. These techniques form the foundation of early diagnosis and routine screening practices.
Figure 4
Figure 4. Applied materials and methods for early detection and analysis of accurate breast cancer diagnosis using deep supervised learning.
The integrated approach, including data preprocessing, feature extraction, model training, and validation. The methodology emphasizes deep supervised learning to improve diagnostic accuracy and enhance patient outcomes.
Figure 5
Figure 5. Pre-processing of the image dataset for breast cancer detection using advanced techniques.
Key steps in image dataset preparation, including noise reduction, normalization, augmentation, and segmentation. These processes enhance data quality for improved model performance in diagnosis.
Figure 6
Figure 6. (A) Model training accuracy graph, (B) model loss graph, (C) training and validation accuracy graph, and (D) training and validation accuracy graph.
The performance metrics of the deep supervised learning model during training and validation phases. (A) The improvement in training accuracy over epochs. (B) The corresponding reduction in training loss, reflecting effective model optimization. (C) The accuracy between training and validation datasets, demonstrating the model’s ability to generalize well to unseen data. (D) The decrease in loss for both training and validation datasets, ensuring consistent performance and minimizing the risk of overfitting.
Figure 7
Figure 7. Heatmap of the correlation matrix of the dataset, visualizing relationships between variables.
The correlation coefficients between different features in the dataset. Strong correlations are highlighted in darker colors, providing insights into the relationships between variables and helping to identify potential patterns for model training and feature selection.
Figure 8
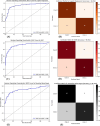
Figure 8. (A) ROC curve for logistic regression, (B) confusion matrix for logistic regression, (C) ROC curve for SVM, (D) confusion matrix for SVM, (E) ROC curve for GNB, (F) confusion matrix for GNB.
The performance metrics for three classification models: logistic regression, support vector machine (SVM), and Gaussian naive Bayes (GNB). Graphs (A), (C), and (E) show the receiver operating characteristic (ROC) curves for each model, highlighting their ability to distinguish between classes. Graphs (B), (D), and (F) display the corresponding confusion matrices, providing a detailed breakdown of true positives, false positives, true negatives, and false negatives for each model, which are crucial for assessing model performance.
Figure 9
Figure 9. Performance evaluation of the convolutional neural network (CNN) model showing (A) ROC curve and (B) confusion matrix.
The performance of the CNN model. (A) the ROC curve, which assesses the model’s ability to differentiate between classes. (B) the confusion matrix, providing a detailed breakdown of true positives, false positives, true negatives, and false negatives, essential for evaluating model accuracy and performance.

References

    1. Abdelhafiz D, Yang C, Ammar R, Nabavi S. Deep convolutional neural networks for mammography: advances, challenges and applications. BMC Bioinformatics. 2019;20(S11):281. doi: 10.1186/s12859-019-2823-4. - DOI - PMC - PubMed
    1. Abdullah TAA, Zahid MSM, Ali W. A review of interpretable ml in healthcare: taxonomy, applications, challenges, and future directions. Symmetry. 2021;13(12):2439. doi: 10.3390/sym13122439. - DOI
    1. Abu Abeelh E, AbuAbeileh Z. Comparative effectiveness of mammography, ultrasound, and mri in the detection of breast carcinoma in dense breast tissue: a systematic review. Cureus. 2024;16:e59054. doi: 10.7759/cureus.59054. - DOI - PMC - PubMed
    1. Abunasser BS, Al-Hiealy MRJ, Zaqout IS, Abu-Naser SS. Convolution neural network for breast cancer detection and classification using deep learning. Asian Pacific Journal of Cancer Prevention. 2023;24(2):531–544. doi: 10.31557/APJCP.2023.24.2.531. - DOI - PMC - PubMed
    1. Acs B, Rantalainen M, Hartman J. Artificial intelligence as the next step toward precision pathology. Journal of Internal Medicine. 2020;288(1):62–81. doi: 10.1111/joim.13030. - DOI - PubMed

LinkOut - more resources