

A comprehensive splicing characterization of COL4A5 mutations and prognostic significance in a single cohort with X-linked alport syndrome
- PMID: 40567900
- PMCID: PMC12187779
- DOI: 10.3389/fgene.2025.1564343
A comprehensive splicing characterization of COL4A5 mutations and prognostic significance in a single cohort with X-linked alport syndrome
Abstract
Introduction: X-linked Alport syndrome (XLAS), caused by mutations in the COL4A5 gene, is an X-linked hereditary disease typically characterized by renal failure, hearing loss, and ocular abnormalities. It is a leading hereditary cause of end-stage renal disease (ESRD) worldwide. Studies on the genotype-phenotype correlation in Alport syndrome suggest that splicing mutations result in more severe clinical phenotypes than missense mutations. Determining whether COL4A5 mutations lead to aberrant mRNA splicing is critical for diagnosis and prognosis.
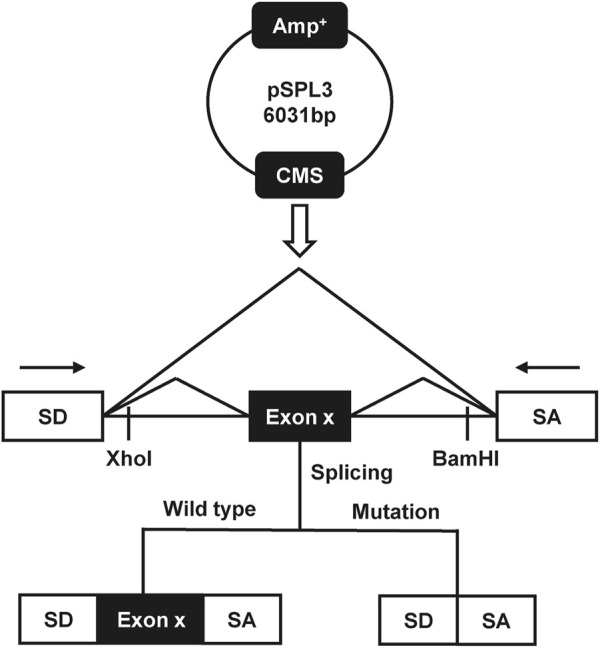
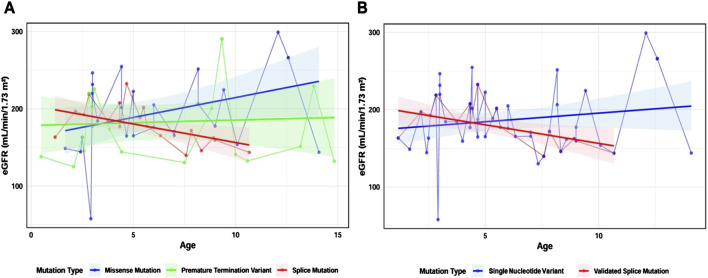
Methods: This study retrospectively reviewed pediatric XLAS patients with COL4A5 gene mutations from a single-center cohort, summarizing and analyzing their clinical features. Minigene assay was employed to evaluate the mRNA splicing functionality of 26 single-nucleotide variants (SNVs), both intronic and exonic, identified in XLAS patients. Bioinformatics tools were used to evaluate the accuracy and sensitivity of splicing mutation prediction. Additionally, linear mixed models were applied to analyze the relationship between mutation types and prognosis in patients' estimated glomerular filtration rate (eGFR), exploring genotype-phenotype correlations.
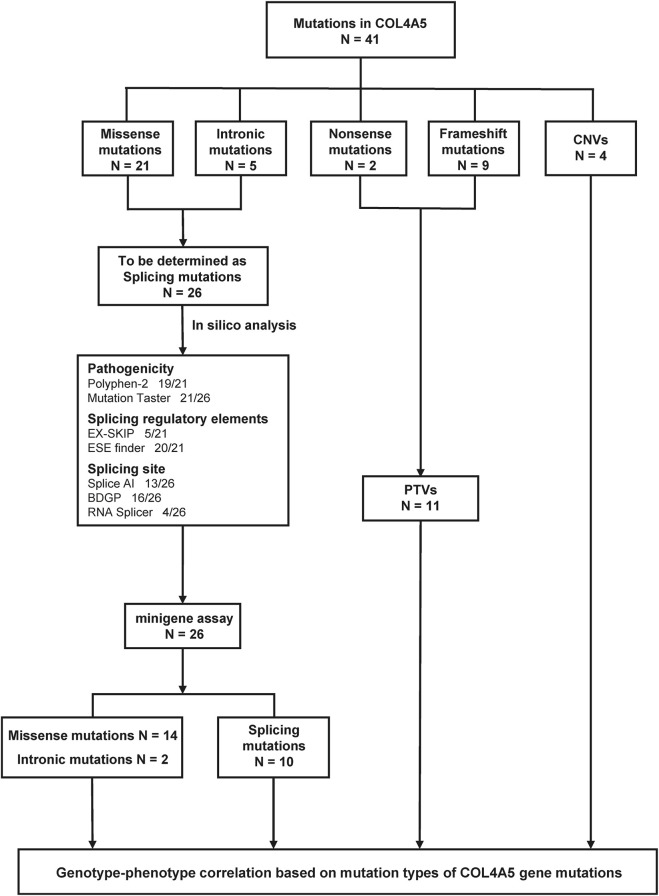
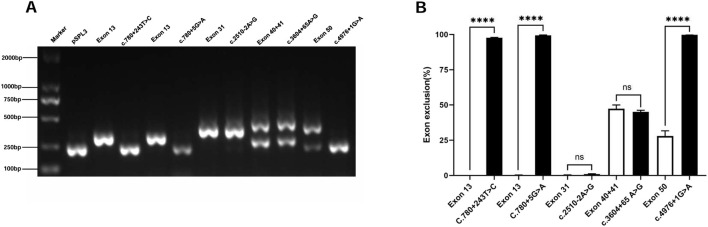
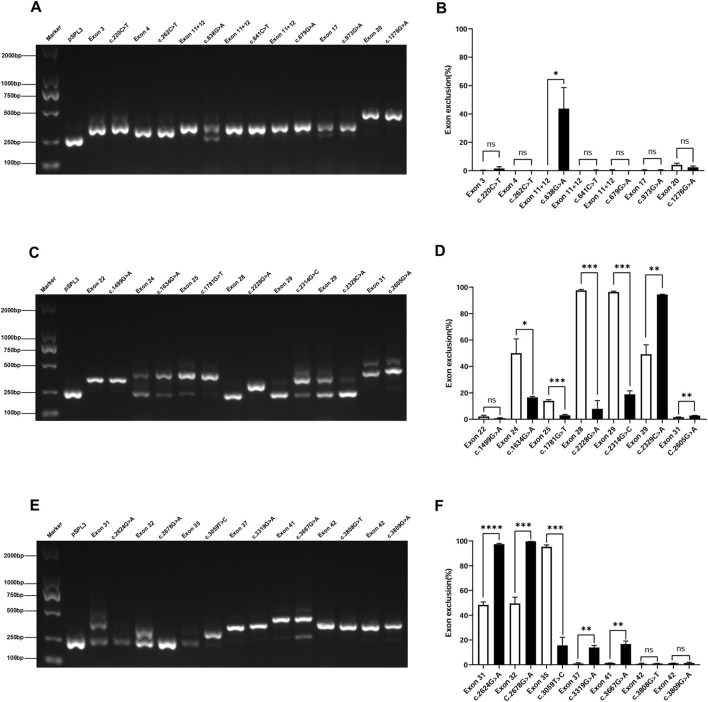
Results: In this cohort, we screened 41 XLAS pediatric patients, including 32 with confirmed XLAS and nine suspected XLAS. The cohort included 21 males (51.2%) and 20 females (48.8%), with a median age at onset of 4.42 years. Among the patients, 22 presented with both hematuria and proteinuria, while 18 exhibited hematuria alone. Notably, only one patient had isolated proteinuria. Regarding mRNA splicing, among the 26 intronic and exonic SNVs, 10 mutations (38.5%) were found to cause aberrant mRNA splicing, as demonstrated by the minigene assay. Sensitivity and specificity assessments of bioinformatics tools revealed that ESE Finder demonstrated higher sensitivity, while RNA Splicer exhibited greater specificity. Furthermore, These splicing abnormalities were closely associated with a faster decline in eGFR.
Conclusion: This study demonstrates that 38.5% of SNVs in the COL4A5 gene result in aberrant mRNA splicing, which is closely linked to renal function decline in XLAS. Splicing mutations are correlated with more rapid renal progression, highlighting the importance of determining the splicing effects of SNVs during genetic screening for XLAS.
Keywords: COL4A5; alport syndrome; mRNA; minigene assay; splicing.
Copyright © 2025 Li, Zhang, Zhou, Wang, Zhu, Zhao, Zhao, Jia, Zhang, Zheng and Ding.
Conflict of interest statement
The authors declare that the research was conducted in the absence of any commercial or financial relationships that could be construed as a potential conflict of interest. The author(s) declared that they were an editorial board member of Frontiers, at the time of submission. This had no impact on the peer review process and the final decision.
Figures
Similar articles
-
A novel COL4A5 splicing mutation causes alport syndrome in a Chinese family.BMC Med Genomics. 2024 Apr 26;17(1):108. doi: 10.1186/s12920-024-01878-8. BMC Med Genomics. 2024. PMID: 38671472 Free PMC article.
-
Signs and symptoms to determine if a patient presenting in primary care or hospital outpatient settings has COVID-19.Cochrane Database Syst Rev. 2022 May 20;5(5):CD013665. doi: 10.1002/14651858.CD013665.pub3. Cochrane Database Syst Rev. 2022. PMID: 35593186 Free PMC article.
-
Systematic review on urine albumin testing for early detection of diabetic complications.Health Technol Assess. 2005 Aug;9(30):iii-vi, xiii-163. doi: 10.3310/hta9300. Health Technol Assess. 2005. PMID: 16095545
-
Intravenous magnesium sulphate and sotalol for prevention of atrial fibrillation after coronary artery bypass surgery: a systematic review and economic evaluation.Health Technol Assess. 2008 Jun;12(28):iii-iv, ix-95. doi: 10.3310/hta12280. Health Technol Assess. 2008. PMID: 18547499
-
Impact of residual disease as a prognostic factor for survival in women with advanced epithelial ovarian cancer after primary surgery.Cochrane Database Syst Rev. 2022 Sep 26;9(9):CD015048. doi: 10.1002/14651858.CD015048.pub2. Cochrane Database Syst Rev. 2022. PMID: 36161421 Free PMC article.
References
LinkOut - more resources
Full Text Sources
Research Materials
Miscellaneous