. 2023 Feb 15;3(1):100158.
doi: 10.1016/j.ynirp.2023.100158. eCollection 2023 Mar.

An examination of the reliability of seed-to-seed resting state functional connectivity in tinnitus patients

Affiliations

An examination of the reliability of seed-to-seed resting state functional connectivity in tinnitus patients

Sara A Schmidt et al. Neuroimage Rep. .

Abstract

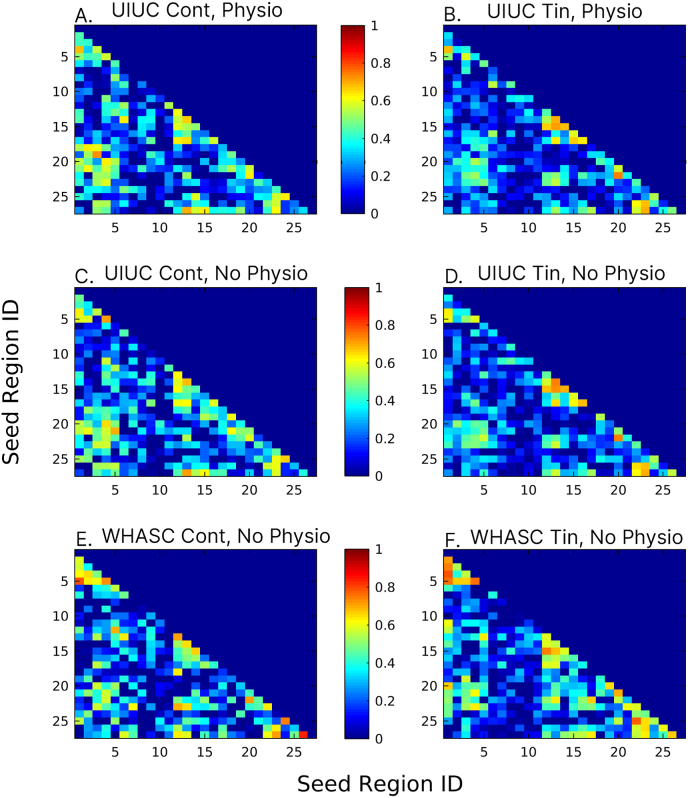
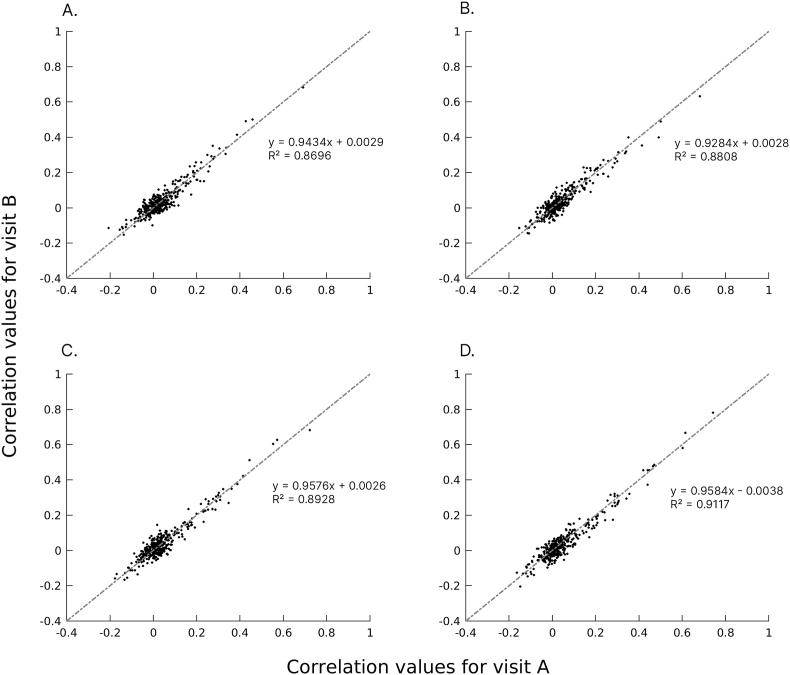
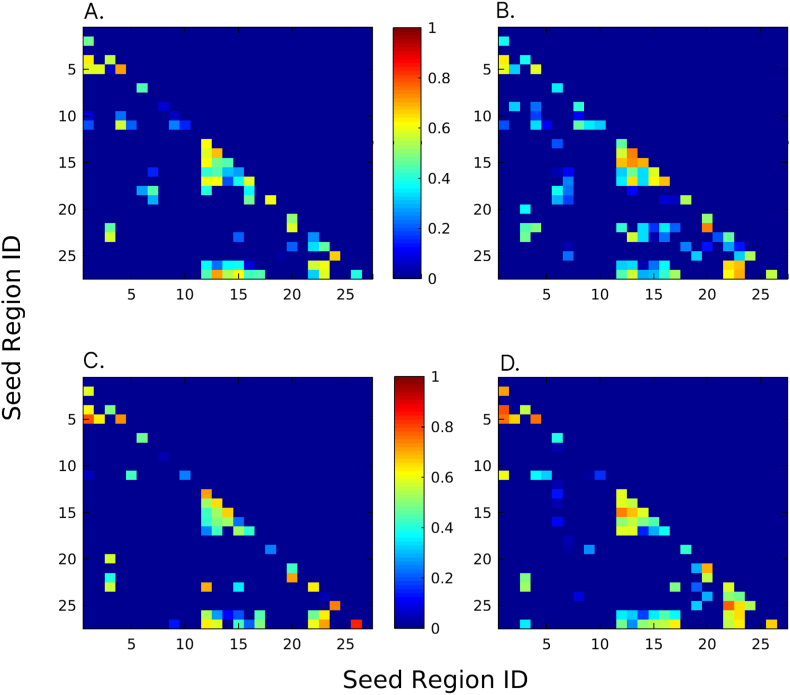
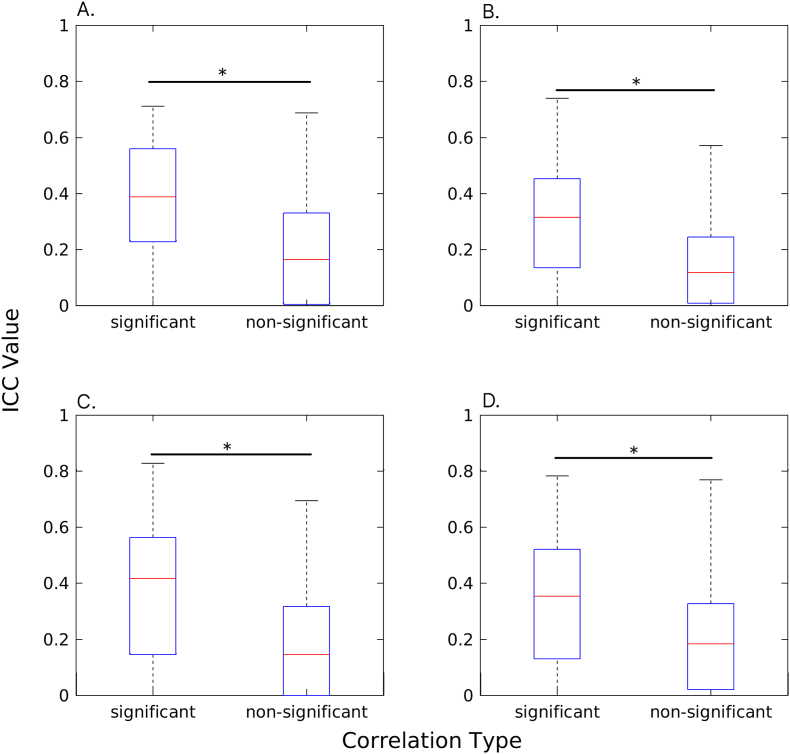
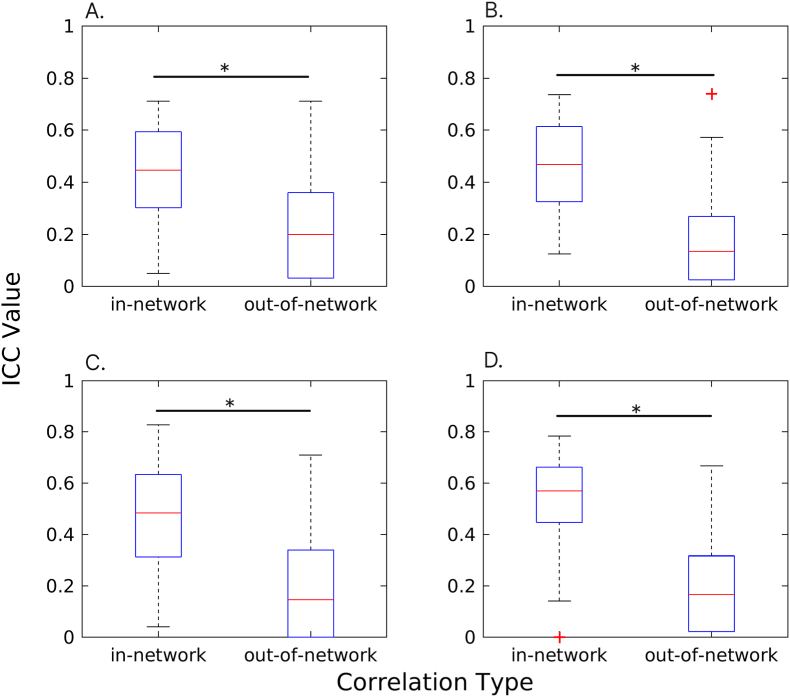
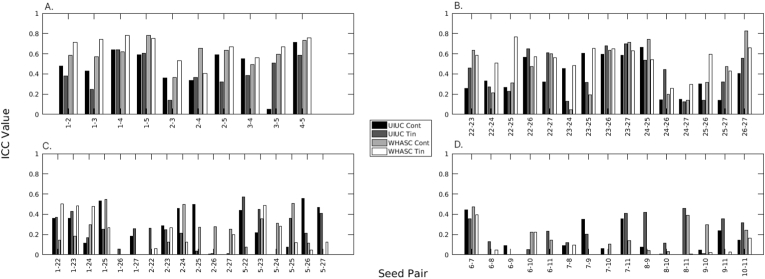
Resting state functional connectivity (RS-FC) studies of tinnitus over the years have produced inconsistent results. While findings can be organized into broad categories, such as increased correlations between auditory and limbic areas in tinnitus patients and a disrupted default mode network, there has been little one-to-one correspondence of results across RS-FC studies of tinnitus. While some of this variation can be explained by the heterogeneity of the tinnitus population, including tinnitus severity, the sources of variability in RS-FC of tinnitus patients are unclear. To directly assess the reliability of RS-FC measures in tinnitus, both tinnitus and control participants from two different sites (University of Illinois at Urbana-Champaign, or UIUC, and the Wilford Hall Ambulatory Surgical Center, or WHASC, at the Lackland Airforce Base in San Antonio, Texas) participated in two resting state MRI scans separated by exactly one week. Seed-to-seed analysis assessing correlations between the fMRI activity of 27 regions in the default mode, dorsal attention, auditory, visual, salience, and emotional processing networks were examined in control and tinnitus participants separately for each site. Additionally, heart rate and respiration measures were collected at UIUC, and the effect of extra physiological corrections using these measures on reliability was examined within the UIUC participants. Intra-class correlation coefficients (ICCs) were used as the measure of reliability. Overall, RS-FC in a seed-to-seed analysis was as reliable in tinnitus participants as it was in control participants in the seed regions examined. As previously shown in studies of participants with normal hearing sensitivity, intra-network reliability was higher than inter-network reliability. Related to this, stronger correlations between two seed regions were predictive of stronger reliability of the connectivity between those regions. These effects were seen in both control and tinnitus populations. Additional physiological corrections did not have a significant impact on the ICC values. The current study demonstrates that, on a whole-brain level, RS-FC assessed via seed-to-seed analysis is reliable in tinnitus participants. We therefore must look to other sources as potential causes of discrepancies across studies, such as variability within analysis techniques or within the behavioral characteristics of tinnitus participants.

Keywords: Default mode network; ICC; Reliability; Resting state functional connectivity; Tinnitus; fMRI.


Conflict of interest statement

The authors declare that the research was conducted in absence of any commercial or financial relationships that could be construed as a potential conflict of interest.

Figures

Fig. 1
Fig. 1
ICC values for correlations between all examined seed regions. Each panel represents a different subject group or analysis technique: A.) UIUC Control participants with additional physiological corrections B.) UIUC Tinnitus participants with additional physiological corrections C.) UIUC Control participants, no additional physiological corrections D.) UIUC Control participants, no additional physiological corrections E.) WHASC Control participants, no additional physiological corrections F.) WHASC Tinnitus participants, no additional physiological corrections. Warmer colors indicate higher ICC values and therefore better reliability. In general, ICC scores for seed pairs across all subject groups are consistent, with warm colors appearing in the same areas of the matrices. Examples of higher reliability can be seen in seeds associated with the DMN and seeds in the visual network. The Seed Region IDs are listed in Table 2; seeds 1–5 represent the default mode network, 6–7 the auditory network, 8–11 limbic regions, 12–17 visual network regions, seeds 18–21 represent the salience network, and seeds 22–27 are in the dorsal attention network.
Fig. 2
Fig. 2
Plots of correlation values between seeds found at visit A vs visit B for each participant group: A.) UIUC Control participants B.) UIUC Tinnitus participants C.) WHASC Control participants D.) WHASC Tinnitus participants Each point on the graphs represent beta-values for two seed regions, with the x value representing the beta-value from visit A and the y-value representing the beta-value from visit B. The line on each graph is the line y = x, which represents ideal replication; points on the line would have identical beta-values at visits A and B.
Fig. 3
Fig. 3
ICC values representing seed pairs that are significantly correlated with one another at a threshold of p < 0.05 FDR correction. This figure is a modified version of Fig. 1; all values in the lower triangle of the ICC matrices for data without physio-correction were set to 0 if they were not representative of a seed pair that was significantly correlated. The resulting areas have generally high ICC values, represented by the warmer colors. A.) UIUC Control participants B.) UIUC Tinnitus participants C.) WHASC Control participants D.) WHASC Tinnitus participants.
Fig. 4
Fig. 4
Box plots illustrating the results of Mann-Whitney U tests comparing ICCs associated with significant correlations and ICCs associated with non-significant correlations. Significance at p < 0.05 is indicated with a * icon, and detailed statistics can be found in Table 7. For all groups, significant correlations had higher ICC values. A.) UIUC Control participants B.) UIUC Tinnitus participants C.) WHASC Control participants D.) WHASC Tinnitus participants.
Fig. 5
Fig. 5
Box plots illustrating the results of Mann-Whitney U tests comparing ICCs associated with within-network seed pairs and ICCs associated with out-of-network pairs. Significance at p < 0.05 is indicated with a * icon, and detailed statistics can be found in Table 7. For all groups, ICCs were significantly higher for within-network seed pairs.A.) UIUC Control participants B.) UIUC Tinnitus participants C.) WHASC Control participants D.) WHASC Tinnitus participants.
Fig. 6
Fig. 6
Bar graphs illustrating the ICC values associated with specific seed pairs. The colors of the bars indicate the participant group and site. Specific seed pairs are indicated on the x-axis, and represent: A.) Correlations within the default mode network B.) Correlations within the dorsal attention network C.) Correlations between seeds in the default mode and dorsal attention networks D.) Correlations between seeds in auditory and limbic regions. The y-axis shows the ICC values; higher ICCs indicate better reliability. There is some group-wise variability within each network, but in general, within-network correlations are more reliable than cross-network ones.

Similar articles

References

    1. Adhikari B.M., Jahanshad N., Shukla D., Turner J., Grotegerd D., Dannlowski U., Kugel H., Engelen J., Dietsche B., Krug A., Kircher T., Fieremans E., Veraart J., Novikov D.S., Boedhoe P.S.W., van der Werf Y.D., van den Heuvel O.A., Ipser J., Uhlmann A., Stein D.J., Dickie E., Voineskos A.N., Malhotra A.K., Pizzagalli F., Calhoun V.D., Waller L., Veer I.M., Walter H., Buchanan R.W., Glahn D.C., Hong L.E., Thompson P.M., Kochunov P. A resting state fMRI analysis pipeline for pooling inference across diverse cohorts: an ENIGMA rs-fMRI protocol. Brain Imaging Behav. 2019;13:1453–1467. doi: 10.1007/s11682-018-9941-x. - DOI - PMC - PubMed
    1. American Tinnitus Association . 2021. https://www.ata.org/understanding-facts Understanding the Facts [WWW Document]
    1. Andellini M., Cannatà V., Gazzellini S., Bernardi B., Napolitano A. Test-retest reliability of graph metrics of resting state MRI functional brain networks: a review. J. Neurosci. Methods. 2015;253 doi: 10.1016/j.jneumeth.2015.05.020. - DOI - PubMed
    1. Andoh J., Ferreira M., Leppert I.R., Matsushita R., Pike B., Zatorre R.J. How restful is it with all that noise? Comparison of Interleaved silent steady state (ISSS) and conventional imaging in resting-state fMRI. Neuroimage. 2017;147 doi: 10.1016/j.neuroimage.2016.11.065. - DOI - PubMed
    1. Bartko J.J. On various intraclass correlation reliability coefficients. Psychol. Bull. 1976;83 doi: 10.1037/0033-2909.83.5.762. - DOI

LinkOut - more resources