[Preprint]. 2025 Jun 12:2025.06.12.659352.
doi: 10.1101/2025.06.12.659352.

Direct RNA nanopore sequencing reveals rapid RNA modification changes following glucose stimulation of human pancreatic beta-cell lines

Affiliations

Direct RNA nanopore sequencing reveals rapid RNA modification changes following glucose stimulation of human pancreatic beta-cell lines

Logan Mulroney et al. bioRxiv. .

Abstract

RNA modifications are critical regulators of gene expression and cellular processes; however, the epitranscriptome is less well studied than the epigenome. Here, we studied transcriptome-wide changes in RNA modifications and expression levels in two human pancreatic beta-cell lines, EndoC-BH1 and EndoC-BH3, after one hour of glucose stimulation. Using direct RNA nanopore sequencing (dRNA-seq), we measured N6-methyladenosine (m6A), 5-methylcytosine (m5C), inosine, and pseudouridine concurrently across the transcriptome. We developed a differential RNA modification method and identified 1,697 differentially modified sites (DMSs) across all modifications. These DMSs were largely independent of changes in gene expression levels and enriched in transcripts for type 2 diabetes (T2D) genes. Our study demonstrates how dRNA-seq can be used to detect and quantify RNA modification changes in response to cellular stimuli at the single-nucleotide level and provides new insights into RNA-mediated mechanisms that may contribute to normal beta-cell response and potential dysfunction in T2D.


Conflict of interest statement

LM has received reimbursement of travel or accommodation expenses to speak at Oxford Nanopore Technologies (ONT) conferences. EB is a paid consultant and shareholder of ONT.

Figures
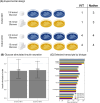
Fig. 1.
Fig. 1.. Study summary.
(A) EndoC-BH1 (top) and EndoC-BH3 (bottom) were cultured in low glucose condition (2.8 mM, blue) or high glucose condition (15.0 mM, yellow). RNA was extracted from each culture and used to prepare native dRNA-seq libraries or in vitro transcribed (IVT) dRNA-seq libraries. (B) Insulin stimulation index (y-axis) across cell lines (x-axis) after one hour of glucose exposure. (C) Detected transcripts (x-axis) by biotype (y-axis).
Fig. 2.
Fig. 2.. Differential RNA modification results.
(A)The estimated effect size (x-axis) and −log10(P-value) (y-axis) for modification sites (points) after high glucose exposure across RNA modifications (facets). A positive effect size corresponds to an increased proportion of modified counts in the high glucose state. Blue points depict FDR< 5% and a subset of genes that contain the DMSs are labeled. (B) Bar plot of the number DMSs (left) or genes with at least one DMS (right), colored by T2D gene status. (C) Network of GO terms enriched (FDR< 5%) in differentially modified sites. Each node is a different GO term with the proportion of each DMS represented by the pie chart. The node size is scaled by the number of genes overlapping each GO term. Edges connect semantically similar nodes, which are also clustered based on similarity.
Fig. 3.
Fig. 3.. RNA modification results at transcript resolution.
RNA modification sites considered (points) along with their genomic coordinates (x-axis) in relationship to the detected transcripts of PDX1–201 (A) and NKX2–2-201 (B) (grey boxes) and the differential modification −log10(P-value) (y-axis). Direction of effect indicated by triangle orientation, where an upward triangle indicates a positive effect (i.e., increased proportion of modified counts in the high glucose condition). Colors depict the RNA modification. Fill status indicates FDR< 5%.
Fig. 4.
Fig. 4.. Differential gene and transcript results.
(A) The estimated effect size (x-axis) and −log10(P-value) (y-axis) for gene or transcript expression (points, facets) after high glucose exposure. Blue points depict FDR< 5%. (B) Comparison of the signed −log10(P-value) for genes (x-axis) and the transcript for the corresponding gene with the smallest P-value (y-axis). (C) Comparison of the signed −log10(P-value) for transcripts (y-axis) and the signed −log10(P-value) of the RNA modification (facets) for the corresponding transcript with the smallest P-value (x-axis).

References

    1. Roundtree I. A., Evans M. E., Pan T. & He C. Dynamic RNA modifications in gene expression regulation. Cell 169, 1187–1200 (2017). - PMC - PubMed
    1. Cappannini A. et al. MODOMICS: a database of RNA modifications and related information. 2023 update. Nucleic Acids Res. 52, D239–D244 (2024). - PMC - PubMed
    1. Anreiter I., Mir Q., Simpson J. T., Janga S. C. & Soller M. New Twists in Detecting mRNA Modification Dynamics. Trends Biotechnol. 39, 72–89 (2021). - PMC - PubMed
    1. Jonkhout N. et al. The RNA modification landscape in human disease. RNA 23, 1754–1769 (2017). - PMC - PubMed
    1. Zhang Z. et al. Systematic calibration of epitranscriptomic maps using a synthetic modification-free RNA library. Nat. Methods 18, 1213–1222 (2021). - PubMed

Publication types

LinkOut - more resources