[Preprint]. 2025 Apr 18:2025.04.16.649000.
doi: 10.1101/2025.04.16.649000.

Immune Niche Formation in Engineered Mouse Models Reveals Mechanisms of Tumor Dormancy

Affiliations

Immune Niche Formation in Engineered Mouse Models Reveals Mechanisms of Tumor Dormancy

Abdul Ahad et al. bioRxiv. .

Abstract

Residual tumor cells can persist in a dormant state during clinical remissions that may last decades. The mechanisms that lead to such growth control vs. eventual reactivation and macroscopic tumor outgrowth remain unclear. Here, we report data from a mouse model that reveals a key role of host immunity and the cellular and molecular mechanisms that control tumor dormancy. Abrogation of myeloid-specific TGF-βRII expression (TβRIImyeKO) resulted in an IFN-γ rich immune microenvironment. IFN-γ in turn elevated KLF4-mediated SLURP1 production in malignant cells, which is critical to the tumor cell quiescent state through interruption of fibronectin-integrin signaling pathways. The dormant tumor lesions were located in spatially localized immune niches rich in NK cells, cDCs, monocytes, and neutrophils, concomitant with tumor cell inactivation of NK cell immune surveillance through a CD200-CD200R1 mechanism. Our studies identify the IFN-γ-KLF4-SLURP1 and CD200-CD200R1 axes as critical molecular drivers in tumor dormancy regulated by immune-tumor crosstalk. These insights provide enhanced mechanistic understanding of tumor dormancy in a mouse model suitable for further investigation of cancer treatment resistance and prevention of metastatic spread.

Keywords: TGF-β; Tumor dormancy; imaging; immune; metastasis; myeloid; niche.


Conflict of interest statement

Conflict of interest statement: The authors declare no potential conflicts of interest

Figures
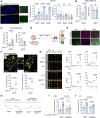
Figure 1.
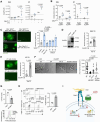
Figure 1.. A mouse model of tumor dormancy induction upon abrogation of myeloid-specific TGF-β signaling.
A. Representative lung surface imaging of metastatic lesions from Tgfbr2MyeKO and Tgfbr2fl/fl (flox cont.) mice that received D2A1-H2B-GFP TVI for 12-14 days (left), and % dormant lesions (<8 cells) (middle) and total tumor lesions (right) at 12, 30, and 50 days after mice received TVI of tumor cells. n=7-9 mice per group. B. % 1-8 cell tumor lesions (left) and total tumor lesions (right) from the TSAE1+mHer2 TVI model, imaging on day 12. n=4 mice per group. C. % 1-8 cell tumor lesions (left) and total tumor lesions (right) from 4T1 orthotopic model, imaging on day 20. n=6 mice per group. D. Schematic design for sorting dormant (GFP+CVCPos) and proliferative D2A1-H2B-GFP (GFP+CVCNeg) cells. E. Representative lung surface images of dormant (GFP+CVCPos) and proliferative lesions (GFP+CVCNeg) from mice that received TVI of D2A1-H2B-GFP for 12 days. F. Representative Clearing-enhanced 3D (Ce3D) confocal imaging of lung tissues at 12 days after TVI of D2A1-H2B-GFP-mRuby-p27K cells. Green: H2B-GFP, Violet: mRuby-p27, and yellow: aSMA, with enlarged images in the middle panels; % 1-8 cell dormant lesions (lower left) and p27K+ dormant lesions (lower right). n=3 mice per group. G. Representative Imaging flow cytometry of P-p38 and GAS6 in dormant GFP+CVCPos and proliferative GFP+CVCNeg D2A1 cells from Tgfbr2MyeKO and flox cont. mice (left) and average of fluorescence intensity of P-p38 and GAS6 in GFP+CVCPos and GFP+CVCNeg D2A1 and 4T1 cells (right). n=3-4 mice per group. H. Schematic design for the effect of Dox-induced myeloid-TβRII knockdown (KD) and myeloid-TβRII re-expression on dormant lesions. I-J. % dormant lesions from TβRII KD and re-expression after D2A1 TVI (I) and 4T1 orthotopic injection at day 12 (J). n=8 mice per group. All data are presented as mean ± s.e.m. P-values were derived from a two-tailed Student’s t-test and significance was determined by a P-value < 0.05.
Figure 2.
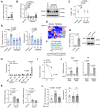
Figure 2.. Increased SLURP1 expression in GFP+CVCPos dormant cells from the Tgfbr2MyeKO mice.
A. Schematic for sorting dormant and proliferative tumor cells using inducible H2B-GFP and CVC membrane labeling (left) and PCA plot from RNA-seq analysis (right). Dorm: sorted dormant tumor cells; Prol: sorted proliferative tumor cells; flox cont. mice; KO: Tgfbr2MyeKO mice. n=3 mice per group. B. Heatmap of 504 differential genes from RNAseq data analysis comparing dormant vs proliferative tumor cells from Tgfbr2MyeKO and flox cont. mice. n=3 mice per group. C. Gene set enrichment analysis (GSEA) of differential genes shown in B. D. Volcano plot for upregulated and downregulated genes comparing dormant cells from the Tgfbr2MyeKO with those from flox cont. mice, with SLURP1 (in red) among the top upregulated. E. TPM values of genes from RNA-seq revealing increased SLURP1 and integrin-mediated pathway including Itgb1, Fn1, uPA and uPAR. n=3 mice per group.
Figure 3.
Figure 3.. The effect of SLURP1 on tumor dormancy.
A. SLURP1 fluorescence intensity in dormant GFP+CVCPos and proliferative GFP+CVCNeg tumor cells from Tgfbr2MyeKO and flox cont. mice by Imaging flow cytometry, D2A1 (left) and 4T1 (right); n=4 biological independent experiments. B. % of SLURP1+ cells with P-p38+ and GAS6+ expression from dormant GFP+CVCPos and proliferative GFP+CVCNeg tumor cells from Tgfbr2MyeKO and flox cont. mice; n=4 four biological independent experiments. C. Representative lung surface imaging (left), and % dormant lesions from D2A1 tumor cells with Slurp1 KO and KD (right). n=5-12 mice per group. D. Western blot for SLURP1 overexpression (SLURP1-OE) in D2A1 tumor cells (D2A1-SLURP1-OE) (left), and % dormant lesions from mouse lungs at 12 days after TVI of D2A1-SLURP1-OE tumor cells (right). E. % dormant lesions from mouse lungs at day 30 after TVI of 4T1-SLURP1-OE tumor cells. n=9-10 mice per group. F. Representative images of D2A1 spheroid culture treated with recombinant SLURP1 (rSLURP1), and rSLURP1 plus an integrin activating antibody (IntA ab), as well as with rSLURP1 withdraw (left) and quantification of spheroid size (right). G-H. Flow cytometry analysis of P-FAK (G), P-p38, P-ERK, and the ratio of P-p38 to P-ERK (H) in 3D-cultured D2A1 cells treated with rSLURP1 or GST control. H. Schematic for SLURP1 mediated inhibition of tumor cell proliferation (created with BioRender.com). All data are presented as mean ± s.e.m. P-values were derived from a two-tailed student t-test. Significance was determined by a P-value< 0.05.
Figure 4.
Figure 4.. IFN-γ-KLF4 axis regulation of SLURP1 expression.
A. SLURP1 expression in cultured tumor cells treated with IFN-γ. n=8, independent biological replicates. B. RT-qPCR and Western blot validation of IFN-γR KD in D2A1 cells. C. SLURP1 expression from Imaging flow cytometry of dormant cells with or without IFN-γR KD, single cell suspension from the lungs of the tumor-bearing mice. n=3 biologically independent experiments. D. Dormant (left) and total tumor lesions (right) from lung surface imaging of mice that received D2A1 cells with or without IFN-γR KD. n=7-8 mice per group. E. TPM expression heatmap of KLF4 transcription family members from RNA-seq of the dormant cells. n=3 mice per group. F. KLF4 binding site mapping in the Slurp1 promoter. Putative KLF4-binding motifs are predicted in the mouse Slurp1 promoter(up) by Homer assay. Klf4 binding motif CCCCACCC were shown in mouse and human Slurp1 promoter. G. RT-qPCR and Western blot of KLF4 overexpression in D2A1 cells. H. Fold enrichment of SLURP1 expression from KLF4-ChIP qPCR of D2A1 cells, n=3 biologically independent experiments. Results shown as mean ± SD. I. DNase-mediated DNA degradation showing KLF4 overexpression protected the KLF4 binding regions in Slurp1 promoter. n=3 biologically independent experiments. Results are shown as mean ± SD. J. RT-qPCR of KLF4 and SLURP1 expression in cultured tumor cells treated with recombinant IFN-γ (left: 4T1, and right: D2A1). K. The effect of KLF4 KD (left) on fold changes of SLURP1 expression (right) in D2A1 cells. n = 3 experiments. L. Dormant (left) and total tumor lesions (right) from lung surface imaging of mice that received TVI of D2A1 tumor cells with KLF4 OE, as well as D2A1 cells with KLF4 OE plus Slurp1 KO. n=7 for each group. Data are presented as mean ± s.e.m. P-values were derived from a two-tailed Student’s t-test. Significance was determined by a P-value< 0.05.
Figure 5.
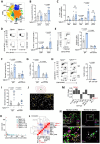
Figure 5.. Elevated IFN-γ levels in metastatic lung tissue and immune niches of the Tgfbr2MyeKO mice.
A. tSNE plots for all myeloid cells by Cytek analysis. B. % CD103+ DCs and plasmacytoid DCs (pDCs) in CD45+CD11b population. C. %TNF-α+ neutrophiles, monocytes, macrophages, CD103+ DCs and pDCs. n=5-6 mice per group. D. Flow cytometry analysis of IFN-γ+CD4 and IFN-γ+CD8 T cells (gated on CD44+ effector cells) from the lung of Tgfbr2MyeKO and flox cont. mice. n=7 mice per group. E. Flow cytometry validation of CD103+ DC depletion. F and G. Tumor lesions in the lungs (F) and Cytek analysis of IFN-γ+CD8+ T cells (G) from the lungs of Tgfbr2MyeKO and flox cont. mice upon CD103+DC depletion. n=3 mice per group. H. Flow cytometry validation of CD8 T cell depletion from the lung of Tgfbr2MyeKO and flox cont. mice. I. Tumor lesions in the lungs of mice with CD8 T cell depletion. n =7 mice per group. J. Strategy for demarcating individual tumor lesions separated by 200 μm distance to define neighbors. n=3 each for Tgfbr2MyeKO and flox cont. mice. K. Distribution of tumor lesion sizes from each mouse lung sample. flox cont. lesions are larger on average (zero-truncated negative binomial regression model, P = 0.0028). L. Pairwise correlations of standardized center log ratios (CLRs) for each immune cell type across all tumor lesions. Two immune niches of commonly co-occurring cell types are outlined and indicated. M. Loadings for PC1 of the PCA, where a positive weight indicates increasing fractional abundance of a cell type as PC1 increases, and a negative weight indicates decreasing fractional abundance of a cell type as PC1 increases. N. Representing images showing niche 2 (CD103+cDCs, NK cells Monocyte/Neutrophils) surrounding dormant tumor lesions in Tgfbr2MyeKO mouse lungs and niche 1 (Alv macrophages, CD8+ and CD4+ T cells) surrounding proliferative tumor lesions. All data are presented as mean ± s.e.m. P-values were derived from a two-tailed student t-test. Significance was determined by a P-value< 0.05.
Figure 6.
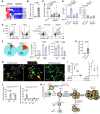
Figure 6.. Mechanisms of immune evasion of dormant tumor cells.
A. Heatmap of the immune evasion genes enriched from the dormant tumor cells from the Tgfbr2MyeKO mice. n=3 mice per group. B. % CD200+ cells in CVCPos dormant tumor cells by Cytek analysis. n=5 mice per group. C. RT-qPCR for validation of CD200 knockdown in D2A1 cells. n=4 biological replicates. D. Number of dormant lesions (left) and total tumor lesions (right) from D2A1 cells with CD200 KD and control. n=5-6 mice per group. E. Flow cytometry gating of CD200R1+ immune cells (left), and CD200R1Hi and CD200R1Low subclusters (right panels). F. Pie chart of major immune cell subsets for CD200R1Hi (left) and percentage and mean immunofluorescence intensity (right) of CD200R1Hi in NK and macrophage cells comparing Tgfbr2MyeKO and flox cont. mice. n=4 mice per group. G. Representative images of CD200R1+ NK and macrophages in the proximity of dormant and proliferative metastatic lesions. H. RT-qPCR validation of CD200 overexpression in D2A1 tumor cells. I % cytotoxic of CD200R1+ NK (left) and macrophage cells (right) co-cultured with D2A1 tumor cells with CD200 overexpression. n=3 biological replicates. J. left: RT-qPCR CD200 mRNA fold change in cultured D2A1 and 4T1 tumor cells in response to IFN-γ treatment; right: fold enrichment of CD200 expression from KLF4-ChIP qPCR of D2A1 cells with KLF4 overexpression. n = 3 biologically independent experiments. Results are shown as mean ± SD. K. Schematic hypothesis for immune-mediated dormancy upon abrogation of myeloid TGF-β signaling: myeloid Tgfbr2 deletion enhances cDC function and activates CD4 and CD8 T cells leading to an IFN-γ rich tumor microenvironment. IFN-γ-induces KLF4-mediated SLURP1 expression which blocks the Integrin-FAK-ERK and induces tumor cell quiescent state. Within the dormant microdomain, the quiescent tumor cells upregulate the immune evasion program through KLF4-CD200-CD200R1 mediated inactivation of NK cells. The CD8 T cells mediated micro tumor dormancy has also been observed in Tgfbr2MyeKO mice as we previously reported. All data are presented as mean ± s.e.m. P-values were derived from a two-tailed student t-test. Significance was determined by a P-value< 0.05.
Figure 7.
Figure 7.. Correlative studies of SLURP1, TβRII, and CD200-CD200R1.
A. SLURP1 expression in four subtypes of breast cancer from METABRIC and TCGA datasets. B. Kaplan-Meier relapse-free survival (RFS) of SLURP1 mRNA expression in breast cancer patients with (left) or without chemotherapy (right). C. Kaplan-Meier distant metastasis-free survival (DMFS) of SLURP1 mRNA expression in luminal B breast cancer patients with (left) or without endocrine therapy (right). D. Heatmap of the SLURP1 expression in cancer cells and TβRII expression in monocytes and neutrophils; and their correlation with Kaplan-Meier disease-free survival (DFS), TCGA CODEFACS, deconvoluted datasets with cell type identification (https://zenodo.org/record/5790343). E. Correlation of SLURP1 levels in cancer cells and TβRII in monocytes and neutrophils with Kaplan-Meier RFS of patients in additional breast cancer datasets. F. Violin plots of SLURP1, INFGR2, KLF4, and IFNγR1 in cancer cells from single-cell RNA sequencing datasets of human breast cancer. Cancer cells were divided by SLURP1 expression (SLURPl-negative cells in blue, SLUPRl-positive cells in red). G. Heatmap analysis of CD200 in cancer cells, CD200R1 in CD56 NK, CD14 monocytes, Treg cells, and CD8 T cells from the TCGA-CODEFACS human breast cancer dataset. H. Correlation of CD200 in cancer cells with CD200R1 in myeloid, NK, CD4 and CD8 T cells. Patients were grouped by average CD200 expression in cancer cells (low in blue, high in red). I. Correlation of dormancy gene signature (expression levels of SLUPR1, INFGR2, KLF4, CD200 in cancer, and CD200R1 in NK cells) with status of T cell expansion in patients who received anti-PDl treatment. J. The expression of PD1 and LAG3 in T cells from patients without T cell expansion, in correlation with high or low dormancy gene signature. All box plots show the 25th percentile, the mean, the 75th percentile and minimum/maximum whiskers. P-values were derived from a two-tailed student t-test for box and violin plots. Statistical significance was determined by log-rank test for survival analysis.

References

    1. Aguirre-Ghiso J.A. Models, mechanisms and clinical evidence for cancer dormancy. Nat Rev Cancer 7, 834–846 (2007). - PMC - PubMed
    1. Sosa M.S., Bragado P. & Aguirre-Ghiso J.A. Mechanisms of disseminated cancer cell dormancy: an awakening field. Nat Rev Cancer 14, 611–622 (2014). - PMC - PubMed
    1. Pan H. et al. 20-Year Risks of Breast-Cancer Recurrence after Stopping Endocrine Therapy at 5 Years. NEngl J Med 377, 1836–1846 (2017). - PMC - PubMed
    1. Goddard E.T., Bozic I., Riddell S.R. & Ghajar C.M. Dormant tumour cells, their niches and the influence of immunity. Nat Cell Biol 20, 1240–1249 (2018). - PubMed
    1. Agudo J. et al. Targeting cancer cell dormancy. Nat Rev Cancer 24, 97–104 (2024). - PMC - PubMed

Publication types

LinkOut - more resources