[Preprint]. 2025 Apr 19:2025.04.15.648984.
doi: 10.1101/2025.04.15.648984.

β-III tubulin identifies anti-fibrotic state of pericytes in pulmonary fibrosis

Affiliations

β-III tubulin identifies anti-fibrotic state of pericytes in pulmonary fibrosis

Ryo Sato et al. bioRxiv. .

Abstract

Pericytes have been implicated in pulmonary fibrosis, yet their activated cellular states and functional roles remain largely unclear. Here, we identified β-III tubulin (Tuj1) as a distinctive marker for fibrosis-associated lung pericytes. Most pericytes in fibrotic regions are Tuj1-positive and interact uniquely with multiple endothelial cells, localizing near collagen-producing fibroblasts and pro-fibrotic SPP1+/arginase+ macrophages. Tuj1 expression is predominantly induced in pericytes during the fibrotic phase, and Tuj1 gene (Tubb3) knockout in mice exacerbates lung fibrosis, accompanied by an increase in the neighboring pro-fibrotic fibroblasts and macrophages, suggesting an anti-fibrotic role for Tuj1-expressing pericytes. Mechanistically, the anti-fibrotic chemokine CXCL10 is upregulated in Tuj1-expressing pericytes, whereas this upregulation is not observed in Tubb3 knockout. Moreover, CXCL10 inhibits the pro-fibrotic differentiation of macrophages induced by lung fibroblasts in culture, implying that CXCL10 may mediate the anti-fibrotic effects of Tuj1-expressing pericytes. These findings underscore the role of lung pericytes in negatively regulating fibrotic process and their potential as therapeutic targets for pulmonary fibrosis patients.


Figures

Figure 1.
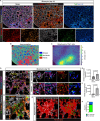
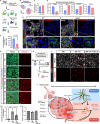
Figure 1.. Identification of β-III tubulin (Tuj1) as a marker for activated pericytes in pulmonary fibrosis.
(A-C) scRNA-seq analysis of the pericyte population from the publicly available dataset of the bleomycin model21. (A) Uniform manifold approximation and projection (UMAP) plots of the re-clustered pericyte population from untreated and bleomycin-treated lungs. (B) Volcano plot showing differentially expressed genes (DEGs) between activated (right) and quiescent (left) pericytes. Red dots represent genes with log2FC > 1 and adjusted P < 0.05. (C) UMAP plots showing the kernel density estimate for Tubb3, Rgs5, and Col18a1 (upper). Bar plots showing the average expression of each gene (lower). (D) Immunostaining of saline- or bleomycin-treated lungs with Tuj1 (green), αSMA (red), and PECAM1 (blue). Scale bars, 100 μm; 10 μm (magnified views). (E) Tuj1+ cells within a fibrotic region at high magnification. Scale bar, 10 μm. (F) Immunostaining of bleomycin-treated lungs with pericyte markers (PDGFRβ, NG2, MCAM; gray), Tuj1 (green), and PECAM1 (red). Scale bars, 4 μm. (G) Immunostaining of bleomycin-treated lungs with Tuj1 (green) and PECAM1 (pink). Arrows indicate Tuj1+ projections aligned with PECAM1+ capillary ECs. Scale bars, 20 μm (left); 8 μm (right). (H) 3D reconstruction image of Tuj1+ cells (green) and PECAM1+ alveolar capillary (pink). Scale bar, 7 μm. (I) Schematic illustration of mosaic pericyte labeling using Pdgfrb-CreERT2; ROSA-LSL-YFP mice. A single low-dose tamoxifen (0.1 mg) was administered before bleomycin treatment, with lung tissues harvested on day 14 post-treatment. (J) Immunostaining of tissue-cleared lungs from bleomycin-treated Pdgfrb-CreERT2; ROSA-LSL-YFP mice with YFP (gray), Tuj1 (green), and PECAM1 (red). Attenuated-maximum intensity projection (attenuated-MIP) was used to visualize 3D lung vascular structures. Boxed regions in attenuated-MIP rendered images of Tuj1neg and Tuj1pos pericytes are magnified as corresponding 3D cropped images on the lower right panels. Scale bars, 10 μm; 2 μm (3D cropped). (K and L) Analysis of fibrotic lung tissues resected from lung cancer patients with idiopathic pulmonary fibrosis (IPF). (K) Hematoxylin and eosin (H&E) staining of the fibrotic lung tissues. Scale bar, 1000 μm. (L) Immunostaining of the fibrotic lung tissues with Tuj1 (green), αSMA (red), and DAPI (blue). Left panel shows a low-magnification image, while right panels present high-magnification images of a representative fibrotic region. Scale bars, 30 μm (left); 10 μm (right).
Figure 2.
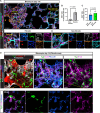
Figure 2.. Bleomycin injury induces Tuj1 expression in most lung pericytes exclusively within fibrotic regions.
(A) Immunostaining of bleomycin-treated lungs with Tuj1 (green), collagen 1 (red), αSMA (brown), podoplanin (gray) and Hoechst33342 (blue). Scale bars, 1000 μm. (B) Area annotation image includes airspace (blue), non-fibrotic (green), and fibrotic (red). (C) Density plot of Tuj1+ cells overlaid on (B). (D) Immunostaining of bleomycin-treated lungs labeled with Tuj1 (green), collagen 1 (brown), podoplanin (gray), PDGFRα (red), PDGFRβ (blue), and PECAM1 (magenta). Upper panels show 2D slice images. Boxed regions in non-fibrotic and fibrotic areas in the left panel are magnified in the right panels. Arrowheads indicate pericytes. Lower left panel shows a maximum intensity projection image. Scale bars, 50 μm (upper and lower left panels); 5 μm (upper right panels). (E and F) Quantification of the total number of pericytes (E) and Tuj1+ pericytes (F) within non-fibrotic and fibrotic areas (n = 3 mice, mean ± SEM, unpaired t test). (G) 3D segmentation of total lung pericytes (gray), Tuj1+ pericytes (green) and Tuj1 pericytes (blue) within fibrotic areas (brown) from the immunofluorescence image in (C). (H) Proportion of Tuj1+ and Tuj1 pericytes within the fibrotic area (mean ± SEM).
Figure 3.
Figure 3.. Tuj1+ pericytes associate with TrkB+ activated capillary endothelial cells.
(A) Immunostaining of bleomycin-treated lungs (single z-slice) with Tuj1 (green), Ki67 (red), collagen 1 (brown), podoplanin (cyan), PDGFRα (gray), PDGFRβ (blue), and PECAM1 (magenta). Scale bars, 30 μm (upper); 5 μm (lower). (B) Quantification of the Ki67-positive ratio in total pericytes within non-fibrotic and fibrotic areas (n = 3 mice, mean ± SEM, unpaired t test). (C) Quantification of Ki67-positive pericytes as a percentage of Tuj1 and Tuj1+ pericyte populations in fibrotic areas (n = 3 mice, mean ± SEM, unpaired t test). (D) Immunostaining of bleomycin-treated lungs with Tuj1 (green), collagen 1 (red), TrkB (magenta), podoplanin (gray), and PECAM1 (blue). Upper: maximum projection images; Lower: magnified single slice images. Scale bars, 20 μm (upper); 5 μm (lower).
Figure 4.
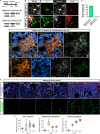
Figure 4.. Tuj1+ pericytes are not collagen-producing cells.
(A) Immunostaining of bleomycin-induced fibrotic lungs (day 21) from Col1a1-EGFP (Col-GFP) reporter mice with Tuj1 (green), αSMA (red), and GFP (gray). Boxed regions are magnified in the panels in (B) to highlight Tuj1-expressing pericyte, VSMC, and fibroblast. Scale bar, 150 μm. (B) Magnified images of Tuj1+ pericytes (αSMA, GFP; upper panels), Tuj1+ VSMCs (αSMA+, GFP; middle panels), and Tuj1weak fibroblasts (αSMA+, GFP+; lower panels). Scale bars, 5 μm. (C) Proportion of Tuj1+ pericytes and VSMCs within total Tuj1+ cells in fibrotic area. (D) RNA in situ hybridization combined with immunostaining of bleomycin-treated lungs, labeled with Col1a1 mRNA (gray), Tuj1 (green), and αSMA (red). Left: lower-magnification overview images of fibrotic area. Right: higher-magnification images of Tuj1+ pericytes. Scale bars, 30 μm (left); 3 μm (right).
Figure 5.
Figure 5.. Tuj1+ pericytes emerge in parallel with fibrosis progression from Pdgfrb-lineage lung pericytes.
(A) Schematic illustration of lineage-tracing experiments in bleomycin-treated lungs from Pdgfrb-CreERT2; ROSA-LSL-YFP and αSMA-CreERT2; ROSA-LSL-RFP mice. Tamoxifen was administered for 4 days before bleomycin treatment, with lung tissues harvested on day 14. (B) Immunostaining of bleomycin-treated lungs from Pdgfrb-CreERT2; ROSA-LSL-YFP (upper) and αSMA-CreERT2; ROSA-LSL-RFP (lower) mice, with Tuj1 (green), lineage-specific reporter protein (gray), and αSMA (red). Arrows indicate Tuj1+ pericytes. Scale bars, 8 μm. (C) Proportion of YFP- or RFP-expressing cells within Tuj1+ pericytes (means ± SEM). (D) Immunostaining of bleomycin-treated lungs from Pdgfrb-CreERT2; ROSA-LSL-YFP mouse, with collagen 1 (brown), podoplanin (blue), YFP (gray), and Tuj1 (green). Scale bars, 100 μm. (E) Time-course analysis of bleomycin-treated lungs. Upper: collagen 1 (red), Tuj1 (green), Hoechst33342 (blue). Lower: segmentation of Tuj1+ pericytes from the upper panels. Scale bars, 80 μm. (F) Temporal emergence patterns of Tuj1+ pericytes, inflammatory and fibrotic fibroblasts in a publicly available time-course scRNA-seq dataset from the bleomycin model14. Relative frequency of these cell types among all cells is calculated for individual mice at specific time points post-injury (n = 3). Box plots indicate median (line), interquartile range: IQR (box), 1.5 x IQR (whiskers), and individual values (dots).
Figure 6.
Figure 6.. Distinctive characteristics of Tuj1+ pericytes compared to Tuj1 pericytes.
(A) GO enrichment analysis of DEGs upregulated in activated pericytes as analyzed in Fig. 1B. Significantly enriched GO terms are listed with their corresponding FDR-corrected P values and associated gene counts. (B) Heatmap of average expression levels for 215 secreted factor genes (matrisome category) in Tuj1neg and Tuj1pos pericytes from bleomycin-treated samples in scRNA-seq dataset21. A highly expressed gene cluster in pericytes (red rectangle) is shown as an enlarged heatmap with gene names on the right. (C) RNA in situ hybridization combined with immunostaining of bleomycin-treated lungs (single z-slice) with Cxcl10 mRNA (red), Tuj1 (green), PECAM1 (magenta), αSMA (brown), podoplanin (gray), and Hoechst33342 (blue). Scale bars, 5 μm. (D) Pathway activity inference of Tuj1neg and Tuj1pos pericytes from bleomycin-treated samples in the scRNA-seq dataset21. (E) Experimental design to study the effects of inflammatory cytokine on Tuj1 expression using primary lung mural cells. (F) Immunostaining of cultured lung mural cells with PDGFRβ (gray), NG2 (red), and Hoechst33342 (blue). Scale bars, 30 μm. (G) Immunostaining of cultured lung mural cells with Tuj1 (green), PDGFRβ (gray), and Hoechst33342 (blue). Cultured for 48 hours in growth medium containing 10% fetal bovine serum (FBS), with or without IFN-γ and TGF-β1. Scale bars, 30 μm. (H) Relative mRNA expression levels of Tubb3 and Cxcl10 in lung mural cells treated with or without IFN-γ and TGF-β1 (n = 3 independent experiments, mean ± SEM, unpaired t test).
Figure 7.
Figure 7.. Loss of the Tuj1 gene exacerbates pulmonary fibrosis.
(A) Immunostaining of lung tissues from wild-type (WT) and Tubb3−/− mice with antibodies to Tuj1 (green), PGP9.5 (gray), αSMA (red), and PECAM1 (blue). Representative images of airway (left) and blood vessel (right) from WT and Tubb3−/− mice are shown. Scale bars, 100 μm. (B) Immunostaining of bleomycin-treated lungs from Tubb3−/− mice and wild-type (WT) control littermates (single z-slice) with collagen1 (red), PDGFRα (gray), Tuj1 (green), PDGFRβ (blue), and PECAM1 (magenta). Scale bars, 30 μm (left); 5 μm (magnified views). (C and D) Quantification of the total number of pericytes (C) and Ki67+ pericytes (D) within the fibrotic regions of WT and Tubb3−/− mice (n = 3 mice per group, mean ± SEM, unpaired t test). (E) Immunostaining of bleomycin-treated lungs from WT and Tubb3−/− mice with collagen1 (gray) and αSMA (red). Scale bars, 500 μm. (F) Hydroxyproline assay of saline- or bleomycin-treated lung tissues from WT and Tubb3−/− mice. For WT mice, n = 5 for saline and n = 10 for bleomycin treatment. For Tubb3−/− mice, n = 3 for saline and n = 7 for bleomycin treatment. Mean ± SEM, unpaired t test.
Figure 8.
Figure 8.. Spatial distribution of Tuj1+ pericytes and pro-fibrotic cells in the fibrotic lung microenvironment.
(A) Immunostaining of bleomycin-treated lungs (single z-slice) with 10 distinct markers using IBEX34. Scale bars, 200 μm (left); 20 μm (right). (B) Image analysis workflow of the IBEX image. (C) Representative image of Tuj1+ pericytes, defined as Tuj1high/PDGFRβ+/PDGFRα cells associated with PECAM1+ capillary ECs. Scale bars, 4 μm. (D) Representative image of fibrotic fibroblasts, defined as collagen 1high/PDGFRα+/PDGFRβ+ cells. Scale bars, 4 μm. (E) Representative image of arginase+ macrophages, defined as arginasehigh/CD68+/CD45+ cells. Scale bars, 4 μm. (F) Spatial analysis of the IBEX image using SPACE37. Covariation plots for Tuj1pos pericytes, alveolar fibroblasts (non-fibrotic area), fibroblasts (fibrotic area), fibrotic fibroblasts, arginase+ macrophages, and arginase macrophages. Plots display a smoothed mean and a smoothed 95% confidence interval, along with continuous enrichment score compared to randomized expectations. (G) Immunostaining of bleomycin-treated lungs with Tuj1 (green), collagen 1 (red), CD68 (blue), arginase (magenta), and SPP1 (gray). Left: maximum projection image; Right: magnified single-slice images of boxed regions (a, b) in the left panel. Scale bars, 30 μm (maximum projection); 5 μm (A); 15 μm (B). MΦ: macrophage.
Figure 9.
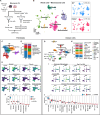
Figure 9.. scRNA-seq analysis revealed the increase of pro-fibrotic cells in Tubb3−/− mice.
(A) Schematic illustration of scRNA-seq analysis for bleomycin-treated lung tissues from WT and Tubb3−/− mice. (B) UMAP plots of all cells with cell cluster annotations (left). Separate UMAP plots for WT and Tubb3−/− samples are displayed on the right panels. (C-F) Cell compositional analysis of the fibroblast population from the scRNA-seq data. UMAP plot of the fibroblasts from both WT and Tubb3−/− mice showing 7 subtypes (C) as defined by marker genes (E). Proportions of each subtype relative to the total fibroblast in WT and Tubb3−/− mice are shown as stacked barplot (D) and boxplot (F). Statistically credible changes, as tested by scCODA, are noted with an * in panel (F). NA: not applicable. (G-J) Cell compositional analysis of the immune cell population from the scRNA-seq data. UMAP plot of the immune cells from both WT and Tubb3−/− mice showing 21 subtypes (G). Expression of marker genes in monocytes/macrophages is shown in (I). Proportions of each subtype relative to the total immune cells in WT and Tubb3−/− mice are shown as stacked barplot (H) and boxplot (J). Statistically credible changes, as tested by scCODA, are noted with an * in panel (J). MΦ: macrophage; Treg: regulatory T cell; cDC1: conventional type 1 dendritic cell; NK: natural killer cell; moDC: monocyte-derived dendritic cell; ILC2: type 2 innate lymphoid cell; DN T cell: double negative T cell; mregDC: mature dendritic cell enriched in immunoregulatory molecules; DP T cell: double positive T cell; pDC: plasmacytoid dendritic cell; NA: not applicable.
Figure 10.
Figure 10.. CXCL10 suppresses the pro-fibrotic activity of macrophages induced by lung fibroblasts.
(A) UMAP plots showing expression of marker genes for mural cell subtypes (VSMC and pericyte) from the scRNA-seq analysis of WT and Tubb3−/− mice. (B-D) scRNA-seq analysis of the pericyte population. (B) UMAP plot of re-clustered WT pericyte (blue) and Tubb3−/− pericyte (red) population. (C) Percentage of WT and Tubb3−/− pericytes relative to total lung cells. (D) Average expression levels of activated pericyte marker genes (Tubb3, Rgs5, and Col18a1) and Cxcl10 in WT and Tubb3−/− pericytes. (E) RNA in situ hybridization combined with immunostaining of bleomycin-treated lungs from WT and Tubb3−/− mice (single z-slice) with Cxcl10 mRNA (red), PDGFRβ (green), PDGFRα (gray), PECAM1 (magenta), collagen 1 (brown), and Hoechst33342 (blue). Pericyte segmentation was performed based on the PDGFRβ, PDGFRα and PECAM1 staining patterns. Scale bars, 20 μm (upper); 5 μm (lower). (F) Quantification of Cxcl10 RNA spots within the segmented pericyte areas in fibrotic regions of WT and Tubb3−/− mice. (n = 3 mice, mean ± SEM, unpaired t test). (G) Immunofluorescence images of lung fibroblasts labeled with PDGFRα (green), collagen 1 (red), and the nuclear marker TO-PRO-3 (blue). The freshly isolated lung fibroblasts were cultured for 48 hours in growth medium containing 10% fetal bovine serum (FBS), either alone or supplemented with CXCL10 or TGF-β1, or TGF-β1 and CXCL10 together. Fib: lung fibroblasts; TGFβ: TGF-β1. Scale bars, 50 μm. (H) Experimental design to study the effect of CXCL10 on fibroblast-mediated pro-fibrotic differentiation of bone marrow (BM)-derived macrophages in culture. (I) Immunostaining of cultured BM-macrophages alone, BM-macrophages co-cultured with lung fibroblasts, and BM-macrophages co-cultured with lung fibroblasts in the presence of CXCL10, labeled with CD68 (gray) and arginase (red). Scale bars, 50 μm. MF: BM-derived macrophages; Fib: lung fibroblasts. (J and K) Quantification of arginase expression (J) and total number of macrophages (K). Arginase intensity values from three independent experiments were normalized to their respective macrophage-only controls and combined for statistical analysis (n = 3 independent experiments, mean ± SEM, one-way ANOVA followed by Tukey's multiple comparisons test). (L) Schematic model illustrating the anti-fibrotic role of Tuj1+ lung pericytes during pulmonary fibrosis. Following fibrotic stimuli, damaged type II alveolar epithelial cells (AT2 cells) trigger local inflammation, leading to the recruitment and differentiation of circulating monocytes into pro-fibrotic macrophages (Spp1+/Arg1+). Concurrently, activated alveolar fibroblasts at inflammatory sites differentiate into fibrotic fibroblasts (collagen 1high). In parallel with these pro-fibrotic responses, the local inflammation also activates lung pericytes through IFN-γ and TGF-β signaling, inducing Tuj1 expression. These Tuj1+ pericytes upregulate the anti-fibrotic chemokine CXCL10, which suppresses both angiogenesis and pro-fibrotic activity in macrophages, thereby counteracting the progression of pulmonary fibrosis.

References

    1. Abe Y., Kwon S., Oishi M., Unekawa M., Takata N., Seki F., Koyama R., Abe M., Sakimura K., Masamoto K., Tomita Y., Okano H., Mushiake H., and Tanaka K.F.. 2021. Optical manipulation of local cerebral blood flow in the deep brain of freely moving mice. Cell Rep. 36:109427. - PubMed
    1. Almaça J., Weitz J., Rodriguez-Diaz R., Pereira E., and Caicedo A.. 2018. The Pericyte of the Pancreatic Islet Regulates Capillary Diameter and Local Blood Flow. Cell Metab. 27:630–644.e4. - PMC - PubMed
    1. Alquicira-Hernandez J., and Powell J.E.. 2021. Nebulosa recovers single-cell gene expression signals by kernel density estimation. Bioinformatics. 37:2485–2487. - PubMed
    1. Anderson M.J., Magidson V., Kageyama R., and Lewandoski M.. 2020. Fgf4 maintains Hes7 levels critical for normal somite segmentation clock function. Elife. 9:e55608. - PMC - PubMed
    1. Aran D., Looney A.P., Liu L., Wu E., Fong V., Hsu A., Chak S., Naikawadi R.P., Wolters P.J., Abate A.R., Butte A.J., and Bhattacharya M.. 2019. Reference-based analysis of lung single-cell sequencing reveals a transitional profibrotic macrophage. Nat. Immunol. 20:163–172. - PMC - PubMed

Publication types