[Preprint]. 2025 Jun 11:2025.06.09.658729.
doi: 10.1101/2025.06.09.658729.

Maintenance of chronic neuroinflammation in multiple sclerosis via interferon signaling and CD8 T cell-mediated cytotoxicity

Affiliations

Maintenance of chronic neuroinflammation in multiple sclerosis via interferon signaling and CD8 T cell-mediated cytotoxicity

Syed Ali Raza et al. bioRxiv. .

Abstract

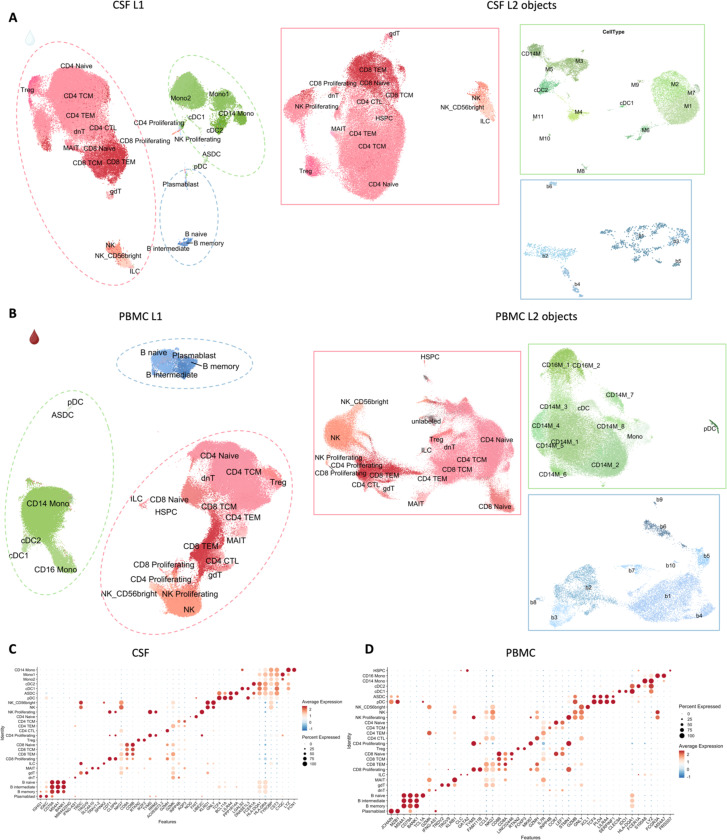
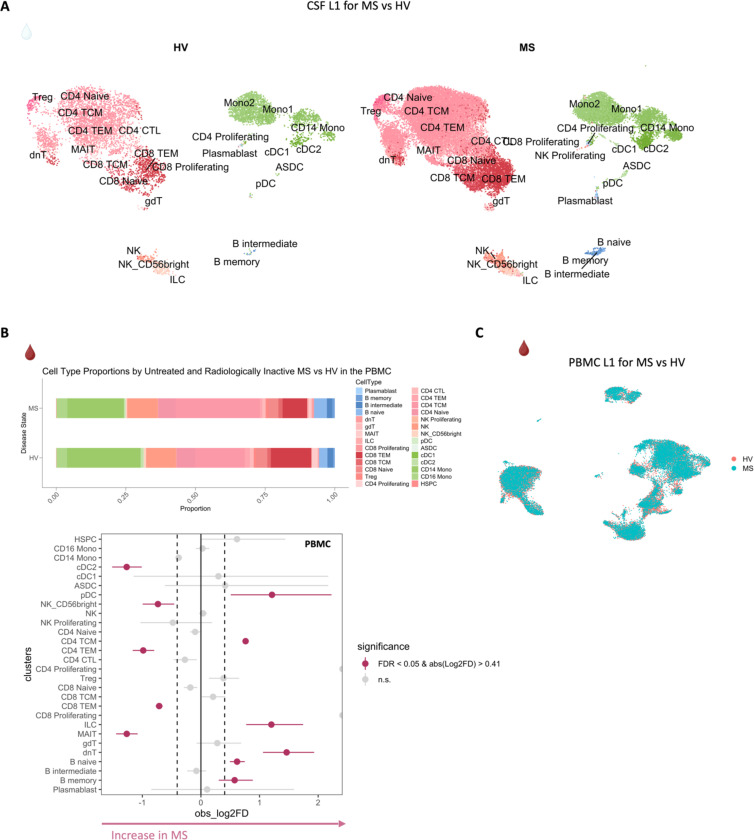
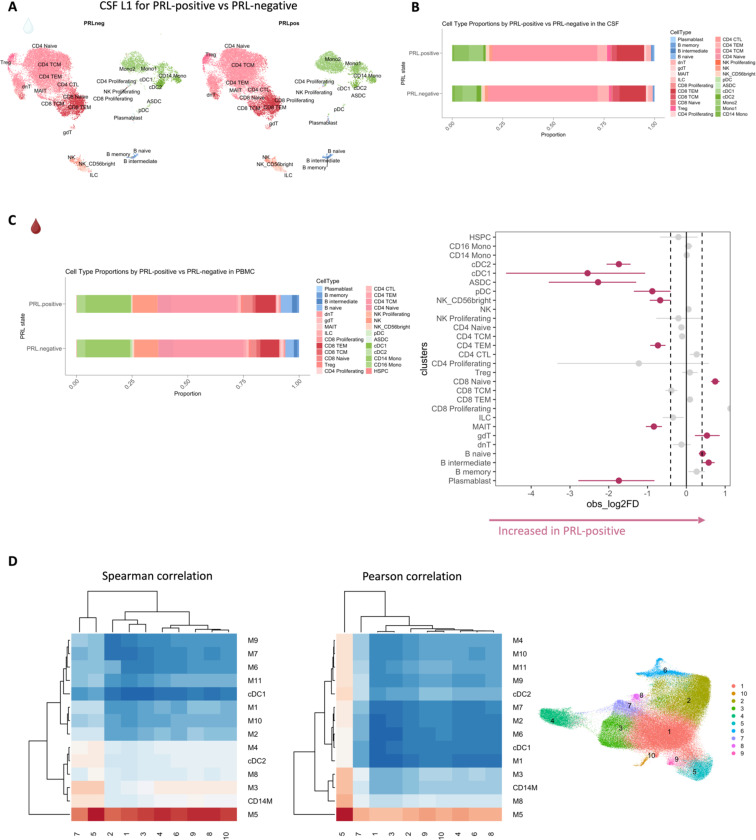
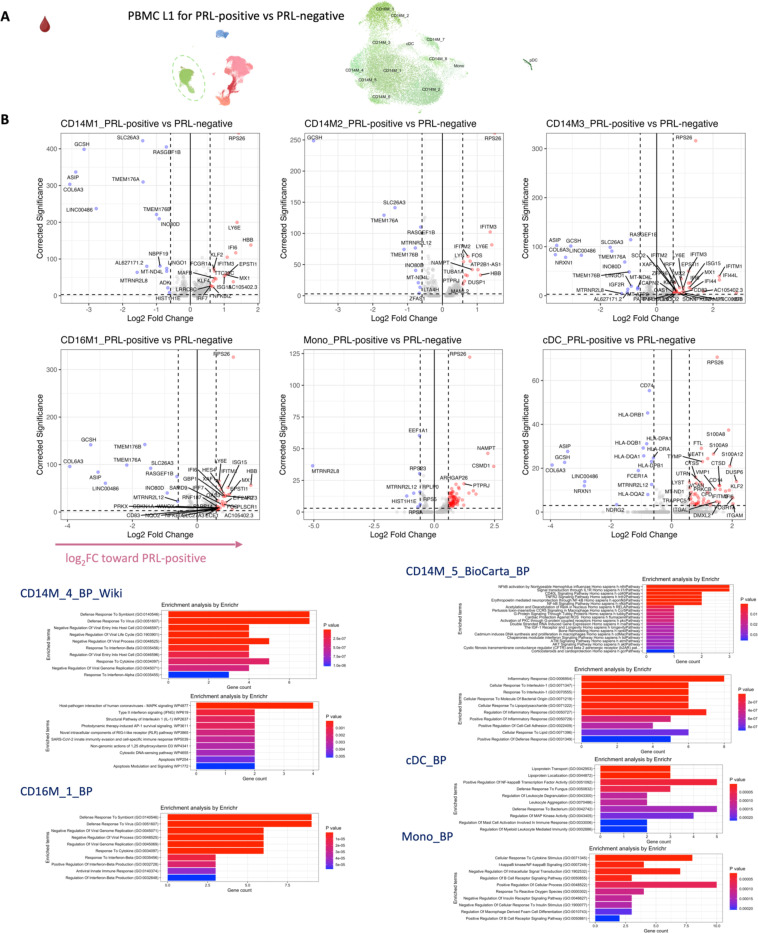
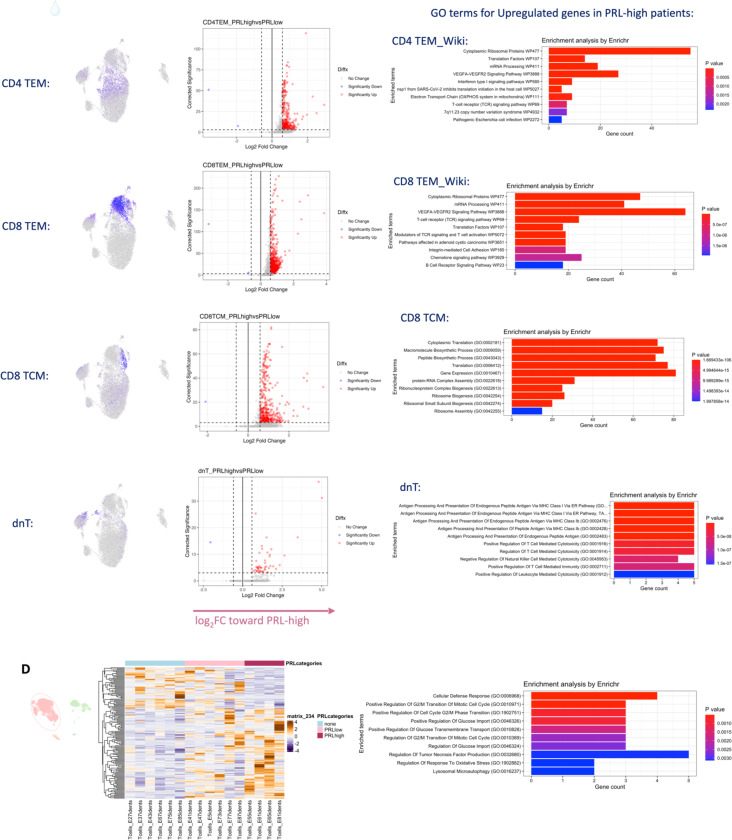
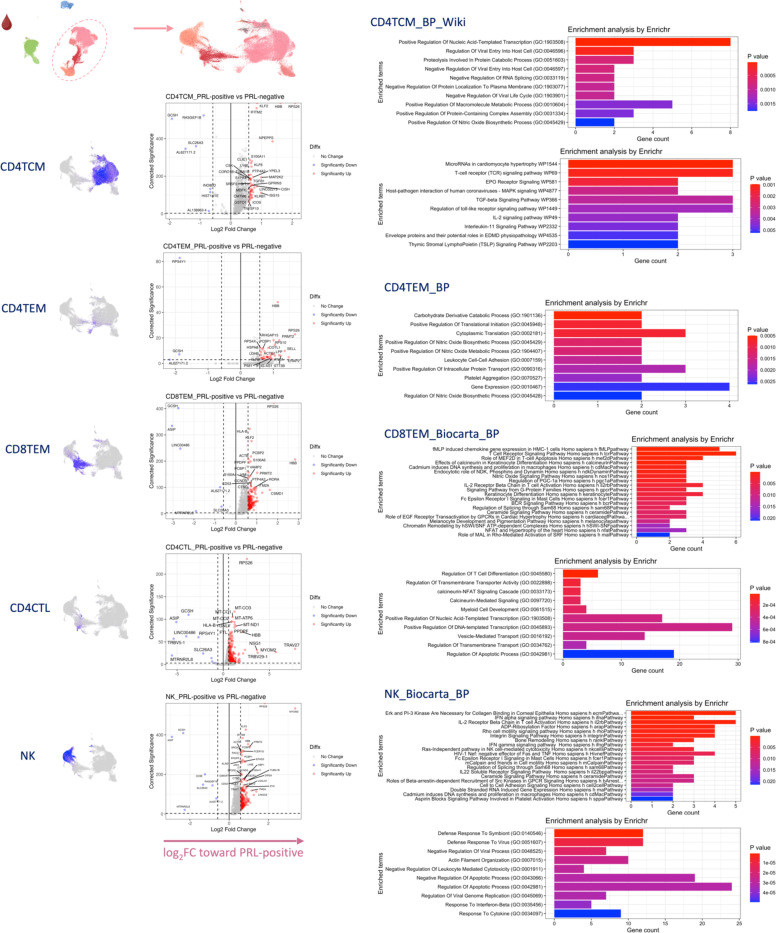
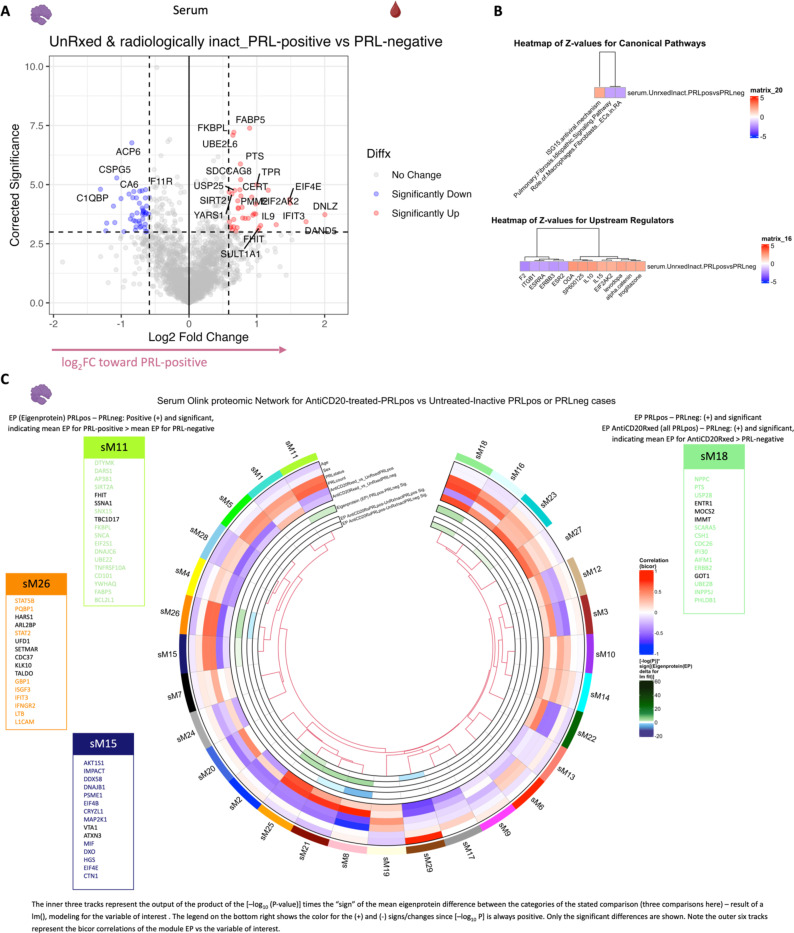
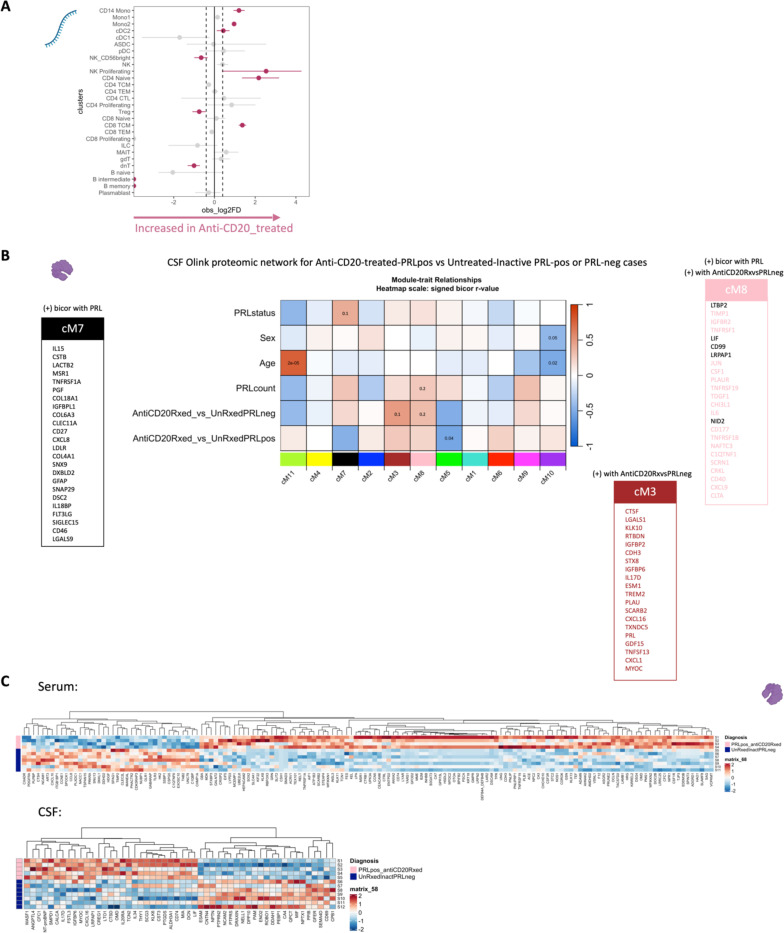
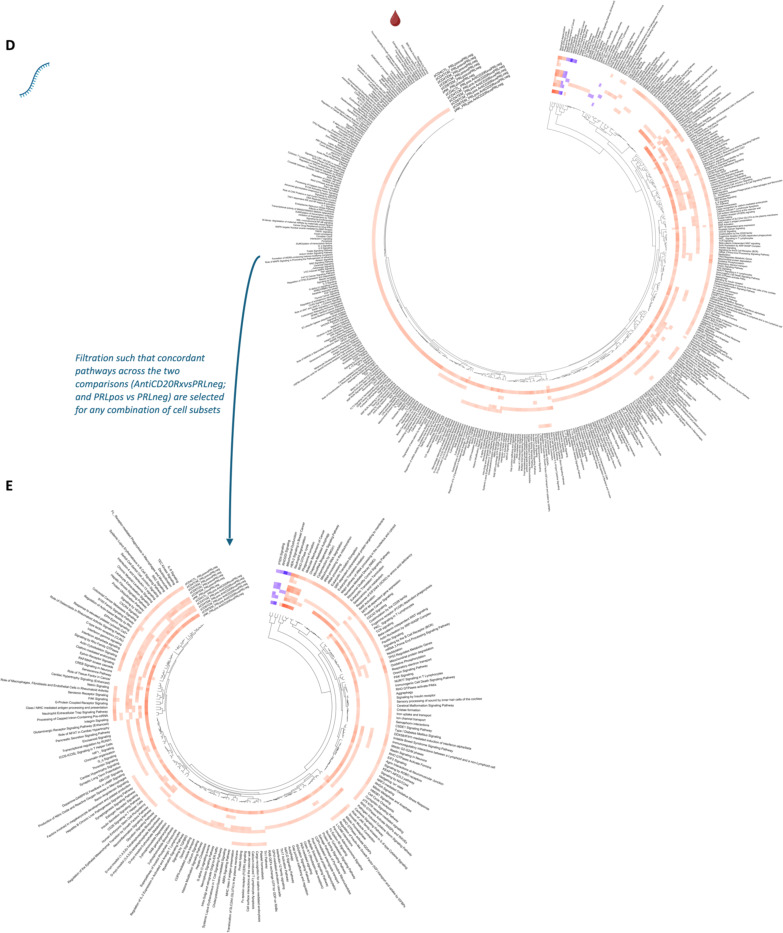
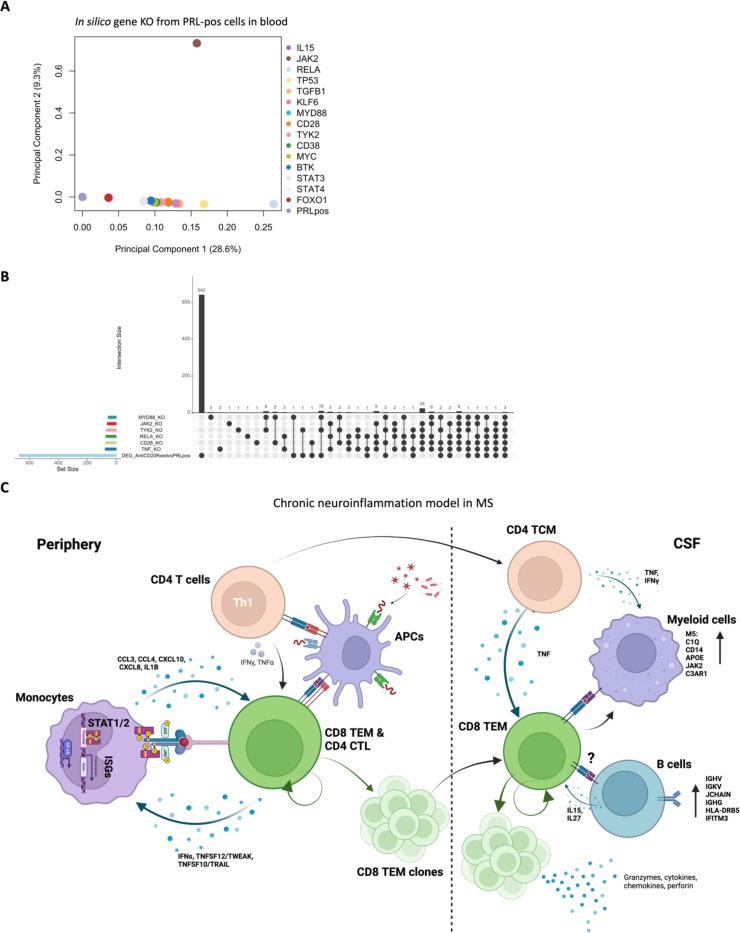
Chronic neuroinflammation and neurodegeneration are critical but unresolved drivers of disability accumulation in progressive multiple sclerosis (MS). Chronic active white matter lesions (CAL), identifiable radiologically as paramagnetic rim lesions (PRL), indicate progression-relevant chronic neuroinflammation. Using single-cell transcriptomics (scRNAseq) and T-cell receptor sequencing (scTCR-seq), we profiled cerebrospinal fluid (CSF) and blood immune cells of 34 radiologically characterized adults with MS (17 untreated, 6 treated with B-cell-depletion) and 5 healthy controls. Coupled with proteomics, we found PRL-associated enrichment of interferon (IFN) signaling and upregulation of TCR signaling in CSF and blood. This was accompanied by clonal expansion of CD8+ T effector memory (TEM) cells, with the highly expanded clonal cells exhibiting T helper type 1 (TH1) and cytotoxic profiles. Validating the cytotoxic immune profile in blood using flow cytometry, we identified a cellular correlate of PRL exhibiting features of CD8+ TEMRA cells. Despite B-cell depletion, PRL-associated neuroinflammation, driven by myeloid activation and CD8+ T-cell cytotoxicity, persisted. Serum and CSF proteomic networks showed PRL-pertinent signatures, including networks unaffected by B-cell depletion. Using in silico perturbation, we nominated therapeutic targets, including MYD88, TNF, MYC, TYK2, JAK2, and BTK, for alleviating chronic neuroinflammation in MS. Our findings highlight mechanisms of chronic neuroinflammation in MS and point to potential biomarkers for monitoring disease progression.


Conflict of interest statement

DSR has received research funding from Abata and Sanofi, related to the current study. JMD, DM, ECF were employees of Abata at the time this study was performed and may hold shares and/or stocks in the company. RMR is a venture partner at Third Rock Ventures, is a cofounder of Abata, and may hold shares and/or stocks in the company. ASB, TJT, and DO are employees of Sanofi and may hold shares and/or stocks in the company.

Figures

Extended Figure 1:
Extended Figure 1:. Single-cell transcriptomics reveal compartment-specific cell populations in the CSF and blood
a) Level 2 (L2) analyses of the myeloid, B-lymphoid, and T-lymphoid and NK cell populations of the CSF (enclosed by green, blue, and pink dashed lines, respectively). The L2 subclusters were derived from L1 clusters enclosed within similarly colored dashed lines (right panel). Myeloid CSF cells subclustered into 14 populations with cell markers of the individual cell clusters depicted in Figure S4. L2 analysis of the B-lymphoid cells of the CSF clustered into 6 populations (Figure S5). T-lymphoid and NK cells at L2 are also shown (box enveloped by the pink line). b) L2 analyses of the myeloid, B-lymphoid, and T-lymphoid and NK cell populations of PBMC (enclosed by green, blue, and pink dashed lines, respectively). Peripheral myeloid cells subclustered into 13 populations with the subcluster-defining genes represented in Figure S6. L2 analyses of the peripheral B-lymphoid lineage cells showed 10 populations (markers shown in Figure S7). Note, a combined UMAP of both CSF and PBMC samples is shown in Figure S8. c) Dotplot representing the top 2 canonical cluster-defining genes of the cell populations in the CSF. d) Dotplot representing the canonical marker genes of the cell populations in the PBMCs.
Extended Figure 2:
Extended Figure 2:. Altered CSF and PBMC cellular composition in untreated and inactive MS
a) CSF L1 UMAP for untreated and inactive MS vs. HV. Evident is the enrichment of B-lineage cells in the CSF of patients with MS (see also Fig. 1). b) Stacked column graph summarizing proportions of L1 PBMC annotations in MS and HV (upper panel). Bottom panel shows a lineplot with significant differences in the PBMC cellular composition between untreated and inactive MS cases and HV. There are increased proportions of B-memory, B-naïve, dnT, and CD4 TCM cells in MS cases. CD4 TEM and CD8 TEM cell proportions were decreased in the PBMC of MS cases. c) PBMC L1 UMAP comparing MS and HV with random sampling of 15,000 cells per condition.
Extended Figure 3:
Extended Figure 3:. B-lineage cells are increased in proportion in PBMC of PRL-positive relative to PRL-negative cases
a) CSF UMAP for the PRL-positive versus PRL-negative samples (subset from the main object). b) Stacked bar graph illustrating the L1 CSF cell proportions contrasting PRL-positive versus PRL-negative cases. c) Comparison of the PBMC L1 cell proportions for PRL-positive versus PRL-negative cases shown in stacked bar plots. The panel on the right shows a lineplot contrasting peripheral immune cell compartment of PRL-positive versus PRL-negative cases, showing slightly increased proportion of CD8-naïve and B-intermediate cells in PRL-positive cases. d) Correlation heatmaps (Spearman and Pearson correlations) comparing average transcriptome similarity of L2 annotations of the CSF myeloid cells versus microglia from the dorsolateral prefrontal cortices of an Alzheimer’s disease cohort, showing that M5 myeloid subcluster in the MS CSF most closely resemble microglia in the brain parenchyma.
Extended Figure 4
Extended Figure 4. Relative to low PRL burden (PRL 1–3), high PRL burden (PRL ≥ 4) patients demonstrate increased proportions of B-lineage cells and Tregs in the CSF, and increased proportion of CD4 CTL cells in the blood, of PRL-high cases
a) CSF L1 UMAP for PRL-high (PRL ≥4) versus PRL-low (PRL 1–3) comparison with the total cell population down-sampled equally per condition to 5000 cells. b) Comparison of CSF L1 cell proportions in PRL-high vs. PRL-low cases shown in a stacked bar chart. Bottom panel shows the L1 cell proportions in a stacked bar chart per sample. The line plot on the right contrasts the difference in cell proportions in the sample space for the PRL-high versus PRL-low cases and shows that the CSF of PRL-high cases is enriched with B-intermediate, B-memory, and Treg cells and possibly CD8-naïve, CD8-TCM, and plasmablast cell populations. c) Stacked bar plots summarizing the PBMC L1 cell proportions across the PRL-high vs. PRL-low comparison, and the L1 cell proportions per sample for the same comparison (bottom panel). The line plot illustrates increased proportion of CD4-CTL, CD8-TEM, ILC, B-intermediate, and possibly pDCs in the PBMC of PRL-high cases relative to PRL-low.
Extended Figure. 5
Extended Figure. 5. IFN-mediated regulation of myeloid cells in both CSF and blood in chronic active MS
a) CSF L1 UMAP and the myeloid and B-lineage cell subsets shown on the right of the figure. b) Volcano plot of DEG in CSF myeloid L2 M3 subcluster comparing cells from PRL-positive versus PRL-negative cases. c) Heatmap showing the DEG in CSF myeloid cells across PRL categories. Pseudo-bulk data is shown, using DESeq2 to model for PRL categories. The panels on the right represent GO terms for: (1) genes up-regulated in cases with PRL-high burden vs. none, including terms such as IFN-γ, MAPK cascade; and (2) terms enriched for PRL-high vs. PRL-low cases, including transcription, intracellular signaling by second messengers, or PIP3/Akt activation. The fold-change for this analysis was set at 1.25 and p-value < 0.05. d) Heatmap showing Z-score enrichment of predicted regulatory molecules with a Z-score threshold ≥ abs(±3). Among the enriched predicted regulatory molecules across PRL-positive vs. PRL-negative comparison in the myeloid subsets of blood are IFNG, IFNA2, TNF, and IL1B.
Extended Figure 6:
Extended Figure 6:. Blood CD14+ and CD16+ monocytes demonstrate an inflammatory phenotype in PRL-positive cases
a) PBMC L1 UMAP (left panel) with the peripheral myeloid cells encircled in green and the L2 myeloid subclusters shown in the right panel. b) Volcano plots comparing PRL-positive versus PRL-negative in the peripheral myeloid subsets. c) GO terms for the upregulated genes in PRL-positive for the corresponding myeloid subclusters reveals enrichment of IFN-mediated responses, TNFR2-signaling pathways, response to IL-1, and involvement of canonical NF-κB inflammatory signaling.
Extended Figure 7:
Extended Figure 7:. High PRL burden state correlates with increased myeloid activation involving IFN and NF-κB signaling
PBMC L2 myeloid subclusters and the volcano plots for the DEG contrasting PRL-high to PRL-low cases are shown with the corresponding GO terms. For the upregulated genes, there is enrichment of terms positive regulation of type-I IFN production, response to type-II IFN, response to LPS, regulation of IL-2 production, and IL27-mediated signaling. For the CD14M_6 subcluster, there was also significant downregulation of genes involved in translation and oxidative phosphorylation across cells from PRL-high vs. PRL-low cases.
Extended Figure 8:
Extended Figure 8:. Transcriptional abundances of the IFN pathway genes in the immune cells of blood and CSF
a) Violin plots comparing the expression of IFN-signature score (average module score, defined in the main text) across PRL categories within the peripheral myeloid subclusters (top panel). Violin plots comparing the expression of IFN-signature in the T-lymphoid and NK cells of the blood across PRL categories (none=0, low=1–3, high=≥4) (bottom panel). b) Average expression of the IFN-signature in CSF myeloid (left panel) and T/NK cells (right panel) across PRL categories. c) Average expression of the IFN-signature in various CSF myeloid subclusters (top panel) and T/NK cell subclusters (bottom panel) across PRL categories.
Extended Figure 9:
Extended Figure 9:. Chronic active lesions are associated with peptide biosynthesis, translation, anti-apoptotic mechanisms, and TCR-signaling in the T-cell compartment of the CSF
a) Enrichment of IFN-signature at chronic active lesion edge versus other locations using a previously published dataset. b) Volcano plots for CD8-TCM and CD4-TCM cells in the CSF across PRL-positive vs. PRL-negative showing upregulation of genes like MTRNR2L8, MTRNR2L12, SLC26A3, and PTPRCAP. c) The corresponding GO terms for the upregulated genes in CD8- and CD4-TCM clusters of CSF in PRL-positive relative to PRL-negative (Extended Figure 9C) are shown. Note terms such as peptide biosynthetic process, translation, and negative regulation of apoptotic process. d) Volcano plot for CD4-TEM cell population comparing PRL-positive vs. PRL-negative in the CSF and the corresponding GO terms on the right of the panel.
Extended Figure 10:
Extended Figure 10:. CSF T cells massively upregulate TCR-signaling, oxidative phosphorylation, electron transport chain (ETC) pathways in cases with high PRL burden (PRL ≥ 4)
a) CSF L1 UMAP for the PRL-high vs. PRL-low comparison with L2 T-lymphoid and NK cells in the right panel. b) Upset plot showing the differentially upregulated genes in various T-cell subsets and NK-cells of the CSF in PRL-high vs. PRL-low states. The vertical dashed-line box represents the shared up-regulated genes amongst CD4-TCM and CD8-TEM clusters. Shown also are the GO terms of the shared upregulated genes in the PRL-high group. Note the enrichment of mRNA processing, TCR signaling and activation, OXPHOS/ETC pathway, and STING pathway. Similar transcriptional changes involve the blood adaptive immune cells as well (see Extended Figures 11-12). c) CSF CD4 and CD8 T-cell immune subsets are shown in the L2 UMAPs for lymphoid cell populations on the left. dnT cells are also shown, since they were found in high proportions in untreated and inactive MS cases relative to HV. The volcano plots comparing PRL-high (PRL ≥ 4) vs. PRL-low (PRL 1–3) show differential expression of genes in the various cell populations. Note the remarkable upregulation of genes in PRL-high relative to PRL-low, particularly in the CD4-TCM, CD8-TCM, CD4-TEM and CD8-TEM cells. The GO terms (shown on the right in bar plots) common for the upregulated genes in these cell populations included translation, peptide biosynthesis, mRNA splicing and processing, electron transport chain (OXPHOS in mitochondria), TCR signaling, costimulatory signals for T-cell activation, IFN type-I signaling, and VEGFA-VEGFR2 signaling pathway. The dnT cells were significant for antigen processing and presentation via MHC-I pathway and positive regulation of T cell mediated cytotoxicity. d) Heatmap representation of significant genes in CSF T-cells across PRL categories per pseudo-bulking and DESeq2 (left panel) and the corresponding enrichment terms (right panel). There is similarity in GO terms for genes enriched across PRL categories and those across PRL-high (PRL ≥ 4) relative to PRL-low (PRL 1–3) cases.
Extended Figure 11:
Extended Figure 11:. Peripheral CD4 and CD8 T cell subsets and NK cells upregulate TCR- and cytotoxicity-related responses in PRL-positive cases
PBMC L2 UMAP lymphoid cell subsets and NK cells are represented on the left. Volcano plots comparing PRL-positive versus PRL-negative in peripheral lymphoid and NK cells. Upregulated genes and their corresponding GO terms are shown on the right, with predominant terms including positive regulation of DNA-templated transcription, T-cell differentiation, TCR-signaling pathway, interferon-pertinent signaling, IL2-R β-chain in T-cell activation, regulation of apoptotic process, and negative regulation of viral processes.
Extended Figure. 12:
Extended Figure. 12:. High PRL burden state correlates with increased peripheral TCR-signaling in the lymphoid compartment
PBMC lymphoid cells shown with the L2 UMAP and the Upset plot, showing the overlap between upregulated genes across the PRL-high versus PRL-low comparison. Volcano plots for the CD4-TCM, CD4-TEM, CD8-TEM, and CD4-naïve cell populations are shown with corresponding GO terms for the upregulated genes. The GO terms for the upregulated genes are essentially like those for the upregulated genes in the CSF lymphoid clusters when comparing PRL-high vs. PRL-low. These included translation, peptide biosynthesis, electron transport chain, (OXPHOS), TCR-signaling, MAPK-signaling, type-I and type-II interferon signaling. Note enrichment of VEGFA-VEGFR2 signaling.
Extended Figure 13:
Extended Figure 13:. Clonal expansion of CD8-TEM in the blood and CSF of PRL-positive relative to PRL-negative cases, and clonal “continuity” across compartments
a) Weighted neighbor network (WNN) integration of RNA and TCR modalities in PBMC for creating WNN-based UMAPs with only those lymphoid cells depicted with a corresponding TCR-sequence. This follows from Trex, based pipeline. Left panel illustrates a wnnUMAP with lymphoid cells specific to PRL-positive state (marked by dashed ovals). Cell annotations and clonal frequency plots reveal CD8-TEM and CD4-CTL cells as being clonally expanded with the largest clone sizes. b) Depiction of wnnUMAP integration of CSF RNA and TCR modalities, with cell types and clonal size representations. c) Ball-packing plots depicting the size of the clones within each cluster with the left panel representing data from the CSF of PRL-positive cases and right panel showing PRL-negative cases. Each ball is one clone, and the clone size represents the number of cells belonging to that individual clone. A clone was defined as a group of cells that share identical nucleotide sequences in both the α- and β-chains of their TCRs. Relative to PRL-negative cases, the CSF of PRL-positive cases was clonally expanded, particularly the CD8-TEM cells. d) Ball-packing plots depicting the size of the clones within each cluster with the left panel representing data from the PBMC of PRL-positive cases and right panel showing PRL-negative cases. Each ball is one clone, and the clone size represents the number of cells belonging to that individual clone. Note the increased sizes of each clone in the CD8-TEM and CD4-CTL cell populations in PRL-positive versus PRL-negative conditions. e) Dotplot summarizing the top 15 clonotypes with the CDR3-aa (complementarity-determining region 3–amino acid) sequences shown for both the α- and β-chains in PRL-positive versus PRL-negative samples. Again, evident is the CD8-TEM clonal expansion in the CSF of PRL-positive patients. f) Flow diagram showing the top expanded clones in the blood traced to CSF (top panel) in PRL-positive and PRL-negative cases (left and right respectively). Bottom panel shows the top expanded clones in the CSF traced to blood in the PRL-positive and PRL-negative cases (left and right respectively).
Extended Figure 14:
Extended Figure 14:. Prediction of TCR-specificities and clonal expansion of CD8-TEM cells in chronic active MS
a) Top 15 in blood clonotypes mapped back onto the wnnUMAP of PBMC (left panel) and top 15 clonotypes mapped back onto the wnnUMAP of CSF (right panel). b) Similar clones are seen in PBMC and CSF cells derived from the same patient as seen in the panels on the left (E52/E53) and right (E80/E81). c) Heatmaps showing clonal overlap across samples in the blood (left panel) and CSF (right panel). d) wnnUMAP of PBMC split by PRL status representing the TCR-specificities (epitope predictions) and the list of epitopes. e) Epitope predictions (TCR specificities) shown for the CSF cells in PRL-positive versus PRL-negative cases.
Extended Figure 15:
Extended Figure 15:. Exhaustion and effector memory states of lymphoid cells in the blood and CSF of cases with PRL
a) Volcano plot showing DEG across high-clonal (clone size ≥ 20) versus low-clonal (< 20) cells in CSF. b) Dotplot showing average expression of TH1 and cytotoxicity pertinent genes in high-clonal versus low-clonal cells in blood. c) Dotplot representing TH1 and cytotoxicity signature genes in high-clonal versus low-clonal cells in CSF. d) Dotplot showing expression of genes pertinent to exhaustion and effector memory state in the blood across: (1) high- vs. low-clonal; and (2) PRL categories. e) Dotplot showing expression of genes pertinent to exhaustion and effector memory state in the CSF across: (1) high- vs. low-Clonal; and (2) PRL categories. All panels are related to Figure 3. f) Frequency of CD244+CX3CR1+ (left panel), CD244+CX3CR1+CD45RACCR7 (middle panel) and CD244+CX3CR1+PD-1+TIGIT+CD45RACCR7 (right panel) subsets relative to CD8+ T-cells in the blood across untreated and inactive MS vs. B-cell depleted cases.
Extended Figure. 16:
Extended Figure. 16:. Serum proteomic network reveals signatures associated with the PRL-state
a) Differential abundance of proteins in serum are depicted in a volcano plot comparing PRL-positive vs. PRL-negative cases. b) Z-score enrichment of pathways (top panel) and upstream regulators (bottom panel) for differentially expressed proteins in blood across PRL-positive vs. PRL-negative cases. c) A serum protein co-expression network of 1463 protein assays from Olink measured across 21 individuals (10 untreated and inactive PRL-positive, 7 untreated and inactive PRL-negative, and 4 anti-CD20-antibody treated PRL-positive MS cases). The module eigenprotein (EP) or the first principal component of module expression was correlated with age, sex, PRL status (PRL-positive vs. PRL-negative), PRL count (total number of PRL on the MRI at the time of sample acquisition), anti-CD20-treated against PRL-positive (anti-CD20-treated vs. PRL-positive only), and anti-CD20-treated against PRL-negative (anti-CD20-treated vs. PRL-negative only) status. These correlations are shown in the outer six tracks with the corresponding bar on the upper right (“Correlation (bicor)”). A linear model was used to assess the effect of the variable of interest (PRL-positive vs. PRL-negative, AntiCD20-treated vs. PRL-neg, and AntiCD20-treated vs. PRL-positive) on EP while adjusting for covariates. The inner three tracks show the signed [-log10(one-way ANOVA p-value)] for each comparison (EP PRLpos-PRLneg Sig.; EP AntiCD20RxPRLpos-UnRxInactPRLpos Sig.; and AntiCD20RxPRLpos-UnRxInactPRLneg Sig.), with effect size reflecting the magnitude of EP differences across groups. The lower bar on the right represents this, where color indicates directionality. We used this to infer significant PRL-pertinent modules, which might not be modulated with B-cell depletion.
Extended Figure 17:
Extended Figure 17:. Pathway analyses to dissect correlates of PRL-related pathology which remain unaddressed with B-cell depletion; CD8-TEM cells emerge as central players
a) Lineplot showing increased proportion of CD14 Mono, Mono2, and CD8-TCM cells in the CSF of B-cell-depleted (all PRL-positive) versus PRL-positive cases. b) Heatmap showing module-trait correlation for a CSF protein co-expression network of 758 protein assays from Olink platform measured across 22 samples (10 untreated and inactive PRL-positive, 7 untreated and inactive PRL-negative, and 5 anti-CD20-antibody treated MS patients (all PRL-positive)). The module eigenprotein (first principal component of module expression) was correlated with PRL status (PRL-positive vs PRL-negative), PRL count (total number of PRL on MRI at the time the samples and data were curated), anti-CD20-treated against PRL-negative and anti-CD20-treated against PRL-positive. Despite age- and sex-adjustment of proteins prior to network construction, there were correlations of the modules with age. Note, all anti-CD20-treated patients in the cohort were PRL-positive at the time of sample and data acquisition. c) Heatmap showing proteins enriched in the serum (top panel) and CSF (bottom panel) in CD20-depleted cases (all PRL-positive) vs. untreated and inactive PRL-negative cases. This is related to Figure 4A (note the fold-change in this analysis was 1.25). d) Circular heatmap demonstrating Z-score enrichment of pathways in peripheral lymphoid cells for DEG across B-cell-depleted (all PRL-positive) vs. PRL-negative and PRL-positive vs. PRL-negative comparisons. Enriched pathways in B-cell-depleted (all PRL-positive) vs. PRL-negative, which are simultaneously concordant with the other comparison (PRL-positive vs. PRL-negative), likely reflect the PRL pathology unaccounted for by B-cell depletion. e) Circular heatmap of peripheral lymphoid cells illustrating Z-scores of canonical pathways for DEG concordantly enriched or depleted across B-cell depleted (all PRL-positive) vs. PRL-negative and PRL-positive vs. PRL-negative comparisons. This resulted from filtration of pathways in panel d. Note the concordant terms including IFN-α/β, IFN-γ, ISGylation, TCR, EIF2 signaling, TH1 pathway, neddylation, and MHC-II antigen presentation, which are all enriched in B-cell-depleted (all PRL-positive) vs. PRL-negative and the PRL-positive vs. PRL-negative comparisons. f) Heatmap showing Z-score enrichment of pathways for DEG across B-cell-depleted (all PRL-positive) vs. PRL-negative and PRL-positive vs. PRL-negative cases in peripheral myeloid cells. g) Circular heatmap of the CSF lymphoid subclusters illustrating Z-score enrichment of canonical pathways for DEG across B-cell-depleted (all PRL-positive) vs. PRL-negative and PRL-high vs. PRL-low comparisons. The concordant terms map onto CD8+ T cells, primarily including IFN-γ, IFN-α/β signaling, NF-κB signaling, ERK/MAPK signaling, JAK family kinases in IL6, and TCR signaling among others. CD4-TCM and CD8-TCM subclusters also showed enrichment of pathways suggestive of persistence of “memory” in the CSF in chronic active MS.
Extended Figure 18:
Extended Figure 18:. Nominating new targets for ameliorating chronic neuroinflammation
a) Flow chart schematic illustrating the method used for nominating the upstream molecules regulating PRL-positive pertinent pathology. These nominated upstream regulators were subsequently used for in silico deletion strategies (see Figure 4E-G and Methods) to curate genes lists involved in PRL-pathology that remain unaffected by in vivo and in silico B-cell depletion but might be modulated by the predicted regulatory molecules, as implied by their in-silico deletion. Hence, possible new targets for chronic neuroinflammation in MS. b) Heatmap showing Z-scores of candidate regulators in CSF (left panel) and blood (right panel) myeloid cells across the B-cell depleted vs. PRL-negative and PRL-positive versus PRL-negative comparisons. c) Circular heatmap illustrating top candidate regulatory molecules driving likely PRL-pertinent pathology unperturbed by B-cell depletion, in the lymphoid cells of blood. d) Heatmap representing top predicted regulators in the CSF lymphoid cells across B-cell depleted vs. PRL-negative and PRL-high vs. PRL-low comparisons. e) Upset plot showing shared regulators across CSF and blood cell populations.
Extended Figure 19:
Extended Figure 19:. Curating genes likely linked to PRL pathology and predicted targets for modulation
a) PCA plot of the simulated distances from comparing the gene regulatory network (GRN) of the original PRL-positive state in the blood vs. the GRNs resulting from in-silico KO of the predicted regulators. b) Upset plot showing the overlap of DEG in in vivo B-cell depletion — using anti-CD20-treated vs. PRL-positive comparison in CSF — with the significantly perturbed genes resulting from in silico deletion of the regulators in PRL-positive (untreated and inactive) cells of CSF. Of interest are the genes that are not affected by CD20-depletion and are only predicted to be affected by in silico KO of MYD88, TYK2, JAK2, RELA, CD28, and TNF (Figure 4E). c) Proposed model for the maintenance of chronic neuroinflammation in MS.
Figure 1:
Figure 1:. Multimodal analyses reveal a unique inflammatory profile of the CSF of untreated and inactive MS participants
a) Experimental paradigm of a multimodal approach involving single-cell transcriptomics of the CSF cells and CSF-matched PBMCs from 39 adults (34 MS cases and 5 healthy volunteers, HV) using 10X Genomics platform, coupled with proteomics of the serum and CSF performed using Olink Explorer proximity extension assay. Flow cytometric validation in the blood was also performed. This figure was created using Biorender.com. b) UMAP of the level 1 (L1) scRNA-seq analyses of the cellular compartment in CSF representing 74,501 single-cell transcriptomes with a total of 28 cell clusters. c) UMAP scatter plot of the L1 analyses of PBMCs measuring 177,556 single-cell transcriptomes and illustrating 28 clusters. d) Stacked column graph summarizing proportions of L1 annotations in untreated and inactive MS patients compared to HV (upper panel) in the CSF. Lineplot demonstrating significant differences in the CSF cellular composition between MS cases and HV (lower panel). Single-cell proportion test was used to perform permutation tests, randomly segregating cells into the two conditions while maintaining the original sample size and subsequently calculating proportional difference between the two conditions, followed by comparison with the observed difference (see Methods). Notable are the increased proportions of B-memory, B-intermediate, and dnT cells in the CSF of untreated and inactive MS cases versus HV. e) Volcano plot of differentially expressed proteins (DEP) contrasting the CSF of inactive and untreated MS cases and HV. The purple-colored globular cartoon on the upper-right of the panel represents proteomic data, and we use this throughout the figures to differentiate from the transcriptomic data, which is shown as a wiggly line. The maroon-colored drop represents blood-derived samples, while the clear drop represents CSF-derived samples. (Biorender.com was used for the globular cartoon, wiggle, and two drops.)
Figure 2:
Figure 2:. IFN-signature enrichment in MS cases with PRL
a) In vivo advanced 7-tesla MRI demonstrating three PRL in a 70-year old man with primary progressive MS and untreated with any disease-modifying therapy for approximately 6 months. Axial T2*-weighted motion- and B0-corrected images at 0.5 mm isotropic resolution, magnitude and unwrapped filtered phase images. Images are observed in three planes. A hypointense rim surrounds an isointense core in phase images (bottom row); a central vein sign is also observed through the lesions. On the right of the panel is the PRL categorization. b) CSF L1 UMAP for PRL-positive versus PRL-negative comparison with total cell population down-sampled equally per condition to 12,500 cells. Right panel is a lineplot showing increased proportion of B-intermediate, B memory, plasmablast, T-regulatory, and Mono1 clusters in PRL-positive cases. cDC2 is decreased in proportion in PRL-positive cases. c) Correlation heatmap comparing average transcriptome similarity of CSF myeloid L2 subclusters vs. the immune-cell populations from a previously published snRNAseq dataset in different cases. Subclusters M3 and M5 show the strongest transcriptional similarity to previously identified MIMS-iron and MIMS-foamy microglia at the CAL edge. d) Volcano plots of DEG in CSF M5 myeloid subcluster comparing PRL-positive versus PRL-negative (left panel) and PRL-high versus PRL-low cases (right panel). Corrected significance on y-axes represents -log10(adjusted p-value). e) PBMC myeloid L2 UMAP shown for PRL-positive versus PRL-negative comparison with total cell population randomly down-sampled equally per condition to 7000 cells (left panel). Volcano plots of DEG in the L2 CD14M4 and CD14M5 myeloid clusters comparing PRL-positive versus PRL-negative cells. CD14M4 shows upregulation of IFN-related genes while CD14M5 demonstrates upregulation of chemokines, including CCL3, CCL4, CXCL8, and pro-inflammatory cytokines, including IL1B. f) Transcriptional abundance of genes involved in the IFN pathway in the PBMC represented in a dot plot comparing cells from PRL-positive versus PRL-negative cases (left panel). On the right are violin plots showing enrichment of the average IFN module score (“IFN-signature”) across PRL categories in the myeloid and T/NK cells (right panel) in blood. g) Heatmap demonstrating differentially expressed proteins in CSF across PRL categories in patients. These are the sex- and age-adjusted abundances with abs[(log2(Fold Change (FC))] > 0.58 and p < 0.05. h) Boxplots showing abundance of IFN-related protein assays across patients with 0, 1–3, and ≥4 PRL (PRL categories: none, PRL-low, and PRL-high, respectively) in the serum (* p0.05, ** p0.01). i) Differential abundance of CXCL8 and CXCL10 in the CSF of patients across PRL categories (* p0.05).
Figure 3:
Figure 3:. Clonally expanded CD8-TEM cells with TH1 effector and cytotoxic profiles mark chronic active MS
a) Donut plots representing the relative space occupied by clones at specific proportions in the blood and CSF, further split by PRL-positive versus PRL-negative status. b) Top 15 clonotypes with the CDR3-aa (complementarity determining regions 3 – amino acid) sequences shown for both the α- and β-chains, in the blood. The highly frequent clonotypes were largely found in CD8-TEM and CD4-CTL cells in PRL-positive cases. c) Top expanded clones in the cohort plotted across the blood and CSF compartments. d) Volcano plot showing DEG across high-clonal (clone size ≥20) versus low-clonal (<20) cells in the blood. e) TH1 and cytotoxicity-pertinent genes, and their expression shown as a dotplot in the T-lymphoid and NK cells in the blood across PRL categories: no PRL, 1–3 PRL (PRL low), and ≥ 4 PRL (PRL high). f) Expression of TH1 and cytotoxicity related genes illustrated by a dotplot in the T-lymphoid and NK cells in CSF across PRL categories. g) Percentage of CX3CR1+CD244+ (left panel), CD244+CX3CR1+CD45RACCR7 (middle panel), and CD244+CX3CR1+PD-1+TIGIT+CD45RACCR7 (right panel) cells relative to CD8+ T-cells in the blood across PRL-negative, PRL-low, and PRL-high patients. PRL-high cases have a higher frequency of CD244+CX3CR1+CD45RA-CCR7 CD8+ TEM cells relative to PRL-negative cases. There is a trend towards increasing frequency of CD244+CX3CR1+PD-1+TIGIT+CD45RACCR7 CD8+ T subset with higher PRL burden. Statistical significance was assessed using Kruskal-Wallis’s test (* p < 0.05). h) Correlation of PRL burden with CD244+CX3CR1+PD-1+TIGIT+CD45RACCR7 subset in CD8+ T-cells in the blood.
Figure 4:
Figure 4:. B-cell depletion fails to abrogate myeloid activation and CD8+ T-cell related cytotoxicity in PRL-positive cases, and new predicted targets
a) Upset plot demonstrating protein changes in the serum across B-cell-depleted versus PRL-negative and PRL-positive versus PRL-negative comparisons. The concordantly enriched or depleted proteins across the comparisons represent PRL-related pathology that remains unaddressed by B-cell depletion. b) Gene ontology (GO) terms for the concordantly enriched proteins in serum across the two comparisons: (1) B-cell-depleted versus PRL-negative; and (2) PRL-positive versus PRL-negative cases. c) Heatmap demonstrating Z-score enrichment of canonical pathways across CSF myeloid subclusters for DEG across B-cell-depleted (all PRL-positive) vs. PRL-negative and PRL-positive vs. PRL-negative comparisons. The heatmaps show concordant and discordant pathways between the two comparisons. Concordant pathways may reflect PRL-related pathology unaccounted for by B-cell depletion. See Extended Figure 17 for Z-score enrichment of pathways in CSF and peripheral lymphoid and myeloid cells for similar comparisons. d) Summary of Z-score enrichment of T-cell-related pathways across blood (left panel) and CSF lymphoid (right panel) cell clusters for the DEG across the comparisons shown (refer to Extended Figure 17D-G) e) From left to right: (1) Schematic showing the application of in silico perturbation strategy involving predicted upstream regulators driving PRL-pertinent immune responses (see Methods and Extended Figure 18), starting from the PRL-positive immune cells; (2) PCA plot and corresponding heatmap of the simulated distances from comparing the gene regulatory network (GRN) of the original PRL-positive state in CSF versus the GRN resulting from in-silico KO of the predicted regulator; and (3) heatmap of the simulated distances comparing the GRN of PRL-positive immune cells in blood vs. the same dataset following the gene knock-out (Extended Figure 19A shows the corresponding PCA plot). f) Venn diagram showing the significantly altered genes by in silico CD20-depletion, in silico JAK2, MYD88, TYK2, and RELA KOs. Accompanying are the list of genes that remain unaffected by in silico and in vivo anti-CD20-mediated B-cell depletion strategies, are contributory toward PRL-pathology, and might potentially be perturbed by the gene knock-out. Gene-set enrichment analysis (GSEA) of the significantly altered and ranked genes was performed (Supplementary File 7). g) In silico cell depletions from PRL-positive immune network of CSF, showing TYK2-, MYD88-, RELA-, and JAK2-positive cell-depletion strategies for abrogating PRL-related chronic neuroinflammation.

References

    1. Reich D. S., Lucchinetti C. F. & Calabresi P. A. Multiple Sclerosis. New England Journal of Medicine 378, 169–180 (2018). - PMC - PubMed
    1. Kuhlmann T. et al. Multiple sclerosis progression: time for a new mechanism-driven framework. Lancet Neurol 22, 78–88 (2023). - PMC - PubMed
    1. Luchetti S. et al. Progressive multiple sclerosis patients show substantial lesion activity that correlates with clinical disease severity and sex: a retrospective autopsy cohort analysis. Acta Neuropathol 135, 511–528 (2018). - PMC - PubMed
    1. Ransohoff R. M. Multiple sclerosis: role of meningeal lymphoid aggregates in progression independent of relapse activity. Trends Immunol 44, 266–275 (2023). - PubMed
    1. Absinta M. et al. Association of Chronic Active Multiple Sclerosis Lesions With Disability In Vivo. JAMA Neurol 76, 1474 (2019). - PMC - PubMed

Publication types