. 2025 May 27;28(6):112767.
doi: 10.1016/j.isci.2025.112767. eCollection 2025 Jun 20.

Microendoscopic calcium imaging in motor cortices of macaques during rest and movement

Affiliations

Microendoscopic calcium imaging in motor cortices of macaques during rest and movement

Anne-Caroline Martel et al. iScience. .

Abstract

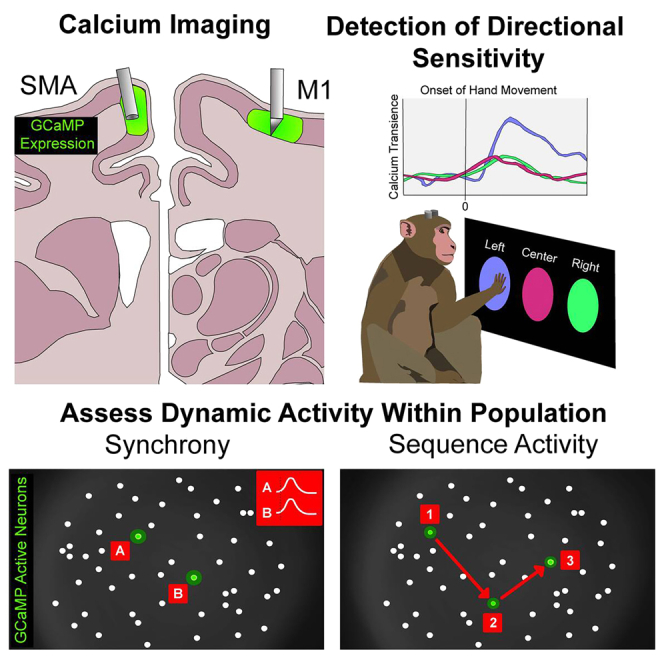
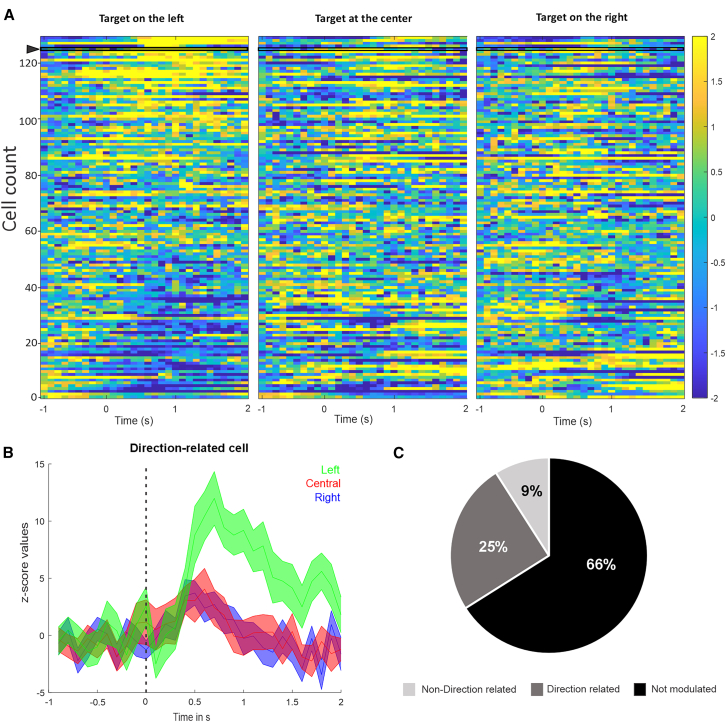
The study of motor cortices in non-human primates is relevant to our understanding of human motor control, both in healthy conditions and in movement disorders. Calcium imaging and miniature microscopes allow the study of multiple genetically identified neurons with excellent spatial resolution. We used this method to examine activity patterns of projection neurons in deep layers of the supplementary motor (SMA) and primary motor areas (M1) in four rhesus macaques. We implanted gradient index lenses and expressed GCaMP6f to image calcium transients while the animals were at rest or engaged in an arm-reaching task. We tracked the activity of SMA and M1 neurons across conditions, examined cell pairs for synchronous activity, and assessed whether SMA and M1 neuronal activation followed specific sequential activation patterns. We demonstrate the value of in vivo calcium imaging for studying patterns of activity in groups of corticofugal neurons in SMA and M1.

Keywords: Behavioral neuroscience; Systems neuroscience; Techniques in neuroscience.


Conflict of interest statement

W.Y., J.D., and J.J.N. are paid employees of Inscopix, Inc. The remaining authors declare no competing interests.

Figures

None
Graphical abstract
Figure 1
Figure 1
Steps of analysis and general description of cell activity (A) Maximal intensity of GCaMP6f fluorescence in the SMA during a single example session (monkey Q), overlapped on the cell map (white) extracted using CNMF-E. Orange, blue, green, and purple symbols mark the example cells shown in (B and C). Scale bars: 100 μm. (B) Raw traces of calcium transients (dF, peak-normalized) during spontaneous activity. (C) Calcium events deconvolved from the calcium traces in (B). (D–F) Boxplots summarizing the event rate (events/s), inter-event interval coefficient of variation (IEI CV), and amplitude of events detected across all sessions in the SMA (left) and M1 (right) in the spontaneous condition (red) and during the arm reaching task (blue). The horizontal bar in each box indicates the median; each circle indicates the median value for a cell. ∗p < 0.05, ∗∗p < 0.001. Wilcoxon signed rank tests corrected for multiple comparisons using the false discovery rate (FDR). See also Tables S1 and S2.
Figure 2
Figure 2
Calcium activity changes in SMA neurons related to the arm reaching task (A) Heat maps of the Z-scored raw calcium traces for each cell in the population, aligned on rewarded target onset on the right, center, or left of the screen during the single-target reaching task in monkey Q (n = 129 cells, average of 30 trials/conditions). In the left panel, the cells have been sorted, based on the amplitude of change in the Z-scored data. On the middle and right panel, cells are sorted in the same order as left panel. (B) Example of a direction-related cell, indicated by the arrowhead in (A), with a significantly higher increase of activity on the rewarded target’s presentation on the left. The cell’s activity is aligned on the rewarded target onset marked by the vertical dash line. Colored curves represent the average Z score activity ±SD, separately for rewarded target on the left (green, p = 0.03), central (red p = 0.92), and right (blue, p = 0.43). (C) Pie chart representing the proportion of cells that were not modulated, direction-related, or non-direction related (black, dark gray, and light gray, respectively). Significance evaluated with an FDR-corrected Wilcoxon signed rank test with p < 0.05. See also Figure S1.
Figure 3
Figure 3
Coactivation between cell events in both SMA and M1 (A) Coactivation plots based on recordings made during the spontaneous and the task conditions in SMA in one example session from monkey U. The shading of squares represents the normalized Jaccard index (Z-Jaccard) for each cell pairing (darker means greater synchrony). On the right of each coactivation plot, we show the scatterplots in which each point represents the Z-Jaccard index for a pair of cells and the distance between their centroids. The blue line is the loess smoother (span = 1) used to visualize whether there is a relationship with distance. No clear patterns emerged. (B) Example session from monkey U in M1. Same legend as (A). (C) Boxplot summarizing the proportion of cell pairs synchronized during spontaneous and task conditions in SMA and M1. The horizontal bars represent the median value across all sessions and animals (monkeys Q, U, V, and F in green, orange, red, and blue, respectively). Each dot represents one session. Spontaneous and task values from the same session are connected by a line. Significance evaluated with a Wilcoxon signed rank test with p < 0.05. No significant differences were identified.
Figure 4
Figure 4
Repeating sequences of calcium events involving several neurons in the spontaneous condition and during the reaching task (A) Top row, depiction of sequences found across 40 cells in an example session in monkey Q’s SMA, during spontaneous and reaching task conditions. The x axis indicates the position of the cell within a sequence. The line thickness indicates the number of repetitions of the sequences. An example sequence starting with cell #5 is highlighted in green for the spontaneous and for the task condition. Below each graph we show the maximal GCaMP6f fluorescence intensity overlapped with the map of cells detected (white circles). The green circles illustrate the three cells involved in the sequence, and the green arrows indicate the temporal order. Although cell #5 initiates the sequence in both examples, it is followed by different cells in the spontaneous and reaching task. Scale bars: 100 μm. (B) Sequences found across 18 cells in a different session in monkey Q’s SMA, during two 10-min segments of the spontaneous conditions (“spontaneous 1,” “spontaneous 2”) and during the reaching task. Same conventions as described for Figure 4A. (C) Spatial distribution of cells involved in sequences. Black bars indicate the distribution of the centroids of all the cells recorded across all sessions in the spontaneous condition in monkey Q SMA (top) and monkey U M1 (bottom). Gray bars indicate the distribution of the centroids of the cells involved in sequences. Note overlap of the distributions, indicating that cells involved in sequences were not clustered but spread across the field of view. (D) Boxplots representing normalized number of sequences, number of repetition, and proportion of cell in sequence across monkeys in SMA (light gray) and M1 (dark gray). The number of sequences normalized by the total number of cells due to the different number of cells identified in each session. Each dot represents median values for a session; the horizontal bars represent the median value across all sessions and animals (monkeys Q, U, V, and F in green, orange, red, and blue, respectively). Data are binned in 10 min of recording in spontaneous (S1 and S2) and during the reaching task (RT). See also Figure S2.

References

    1. Strick P.L., Dum R.P., Rathelot J.A. The cortical motor areas and the emergence of motor skills: a neuroanatomical perspective. Annu. Rev. Neurosci. 2021;44:425–447. doi: 10.1146/annurev-neuro-070918-050216. - DOI - PubMed
    1. Nachev P., Kennard C., Husain M. Functional role of the supplementary and pre-supplementary motor areas. Nat. Rev. Neurosci. 2008;9:856–869. doi: 10.1038/nrn2478. - DOI - PubMed
    1. Picard N., Strick P.L. Motor areas of the medial wall: a review of their location and functional activation. Cereb. Cortex. 1996;6:342–353. doi: 10.1093/cercor/6.3.342. - DOI - PubMed
    1. McFarland N.R., Haber S.N. Organization of thalamostriatal terminals from the ventral motor nuclei in the macaque. J. Comp. Neurol. 2001;429:321–336. doi: 10.1002/1096-9861(20000108)429:2<321::AID-CNE11>3.0.CO;2-A. - DOI - PubMed
    1. Alexander G.E., Crutcher M.D. Functional architecture of basal ganglia circuits: neural substrates of parallel processing. Trends Neurosci. 1990;13:266–271. - PubMed