

The impact of gliomas on resting-state oscillatory activity and connectivity: A magnetoencephalography study
- PMID: 40568440
- PMCID: PMC12172922
- DOI: 10.1016/j.ynirp.2021.100051
The impact of gliomas on resting-state oscillatory activity and connectivity: A magnetoencephalography study
Abstract
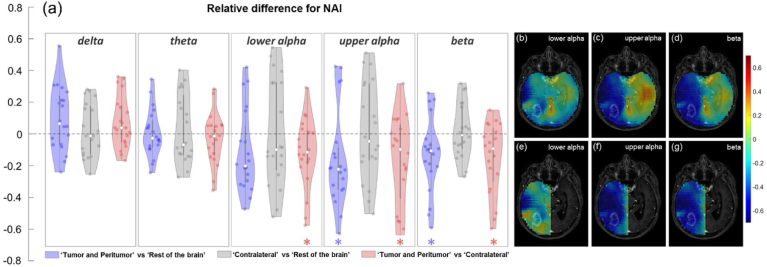
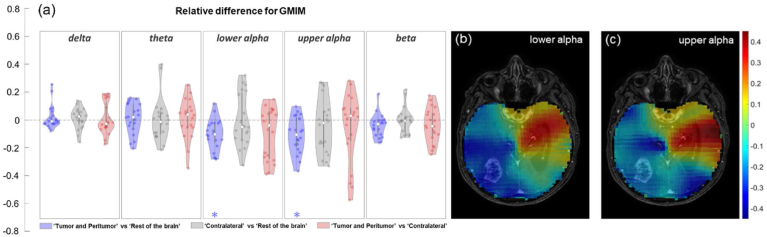
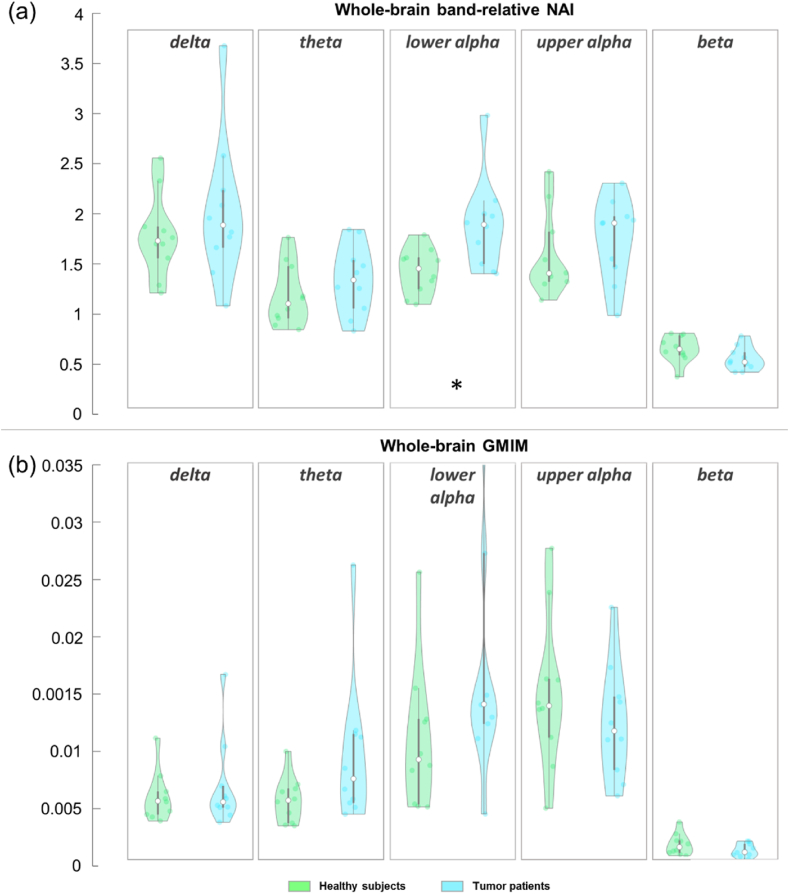
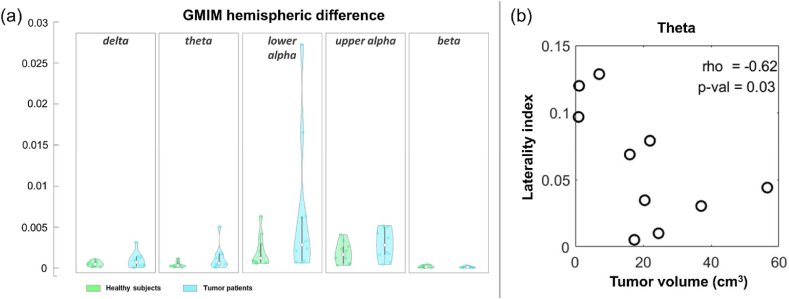
Gliomas disturb brain functions, contributing to abnormal neuronal activity and connectivity changes that can be effectively investigated using magnetoencephalography (MEG). In this work, we used MEG to evaluate frequency-specific alterations of brain activity and functional connectivity in glioma patients. Two consecutive 5-min sessions of eyes-closed resting-state brain activity were recorded from ten glioma patients and ten age-matched healthy subjects. Modulations of power and functional connectivity, within the patient group and between patients and the healthy control group, were assessed in terms of the Neural Activity Index and the Multivariate Interaction Measure, respectively. These quantities were calculated in individualized frequency bands (delta, theta, lower alpha, upper alpha and beta) to account for changes in spectral peaks in patients. We report a decrease in power in tumor and peri-tumor regions in the upper-alpha and beta bands with respect to the rest of the brain, paired to a decrease in lower and upper-alpha band functional connectivity of the tumor and peri-tumor regions. In comparison with healthy subjects, we observe a global enhancement in power in lower-alpha in patients. Overall, our study shows that glioma infiltration can widely influence brain local and long-range synchrony in an individualized frequency-specific manner.
Keywords: Functional connectivity; Glioma patients; Magnetoencephalography; Resting-state.
© 2021 The Authors.
Conflict of interest statement
The author declared no conflict of interest.
Figures
Similar articles
-
Magnetic resonance perfusion for differentiating low-grade from high-grade gliomas at first presentation.Cochrane Database Syst Rev. 2018 Jan 22;1(1):CD011551. doi: 10.1002/14651858.CD011551.pub2. Cochrane Database Syst Rev. 2018. PMID: 29357120 Free PMC article.
-
Systemic pharmacological treatments for chronic plaque psoriasis: a network meta-analysis.Cochrane Database Syst Rev. 2021 Apr 19;4(4):CD011535. doi: 10.1002/14651858.CD011535.pub4. Cochrane Database Syst Rev. 2021. Update in: Cochrane Database Syst Rev. 2022 May 23;5:CD011535. doi: 10.1002/14651858.CD011535.pub5. PMID: 33871055 Free PMC article. Updated.
-
The utility of Magnetoencephalography in multiple sclerosis - A systematic review.Neuroimage Clin. 2021;32:102814. doi: 10.1016/j.nicl.2021.102814. Epub 2021 Sep 9. Neuroimage Clin. 2021. PMID: 34537682 Free PMC article.
-
Diagnostic test accuracy and cost-effectiveness of tests for codeletion of chromosomal arms 1p and 19q in people with glioma.Cochrane Database Syst Rev. 2022 Mar 2;3(3):CD013387. doi: 10.1002/14651858.CD013387.pub2. Cochrane Database Syst Rev. 2022. PMID: 35233774 Free PMC article.
-
Systemic pharmacological treatments for chronic plaque psoriasis: a network meta-analysis.Cochrane Database Syst Rev. 2017 Dec 22;12(12):CD011535. doi: 10.1002/14651858.CD011535.pub2. Cochrane Database Syst Rev. 2017. Update in: Cochrane Database Syst Rev. 2020 Jan 9;1:CD011535. doi: 10.1002/14651858.CD011535.pub3. PMID: 29271481 Free PMC article. Updated.
Cited by
-
Regular physical activity affects brain activities in old individuals: an observational study.PLoS One. 2025 Jul 2;20(7):e0326163. doi: 10.1371/journal.pone.0326163. eCollection 2025. PLoS One. 2025. PMID: 40601547 Free PMC article.
References
-
- Alamian G., Hincapié A.S., Pascarella A., Thiery T., Combrisson E., Saive A.L., Martel V., Althukov D., Haesebaert F., Jerbi K. Measuring alterations in oscillatory brain networks in schizophrenia with resting-state MEG: state-of-the-art and methodological challenges. Clin. Neurophysiol. 2017;128:1719–1736. doi: 10.1016/j.clinph.2017.06.246. - DOI - PubMed
-
- Baayen J.C., de Jongh A., Stam C.J., de Munck J.C., Jonkman J.J., Trenité D.G., Berendse H.W., van Walsum A.M., Heimans J.J., Puligheddu M., Castelijns J.A., Vandertop W.P. Localization of slow wave activity in patients with tumor-associated epilepsy. Brain Topogr. 2003 Winter;16(2):85–93. doi: 10.1023/b:brat.0000006332.71345.b7. - DOI - PubMed
LinkOut - more resources
Full Text Sources