. 2024 Jul 3;4(3):100213.
doi: 10.1016/j.ynirp.2024.100213. eCollection 2024 Sep.

Cortical thickness differences between hearing and perinatally deaf cats using ultra-high field MRI

Affiliations

Cortical thickness differences between hearing and perinatally deaf cats using ultra-high field MRI

Stephen G Gordon et al. Neuroimage Rep. .

Abstract

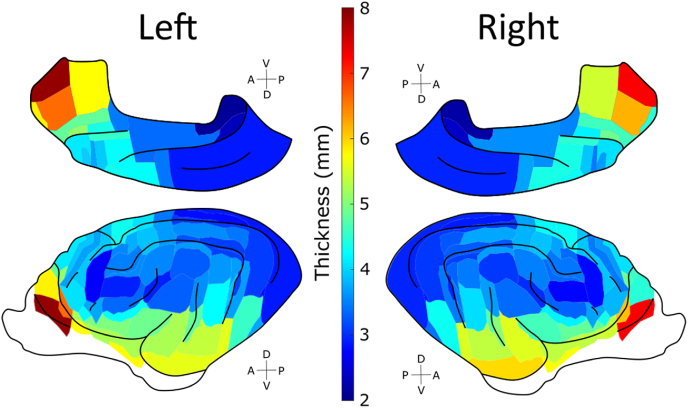
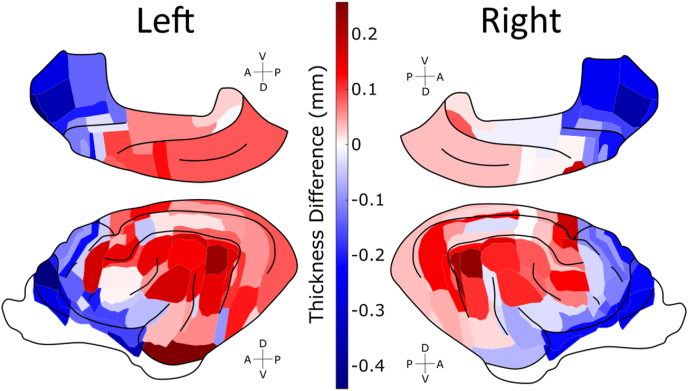
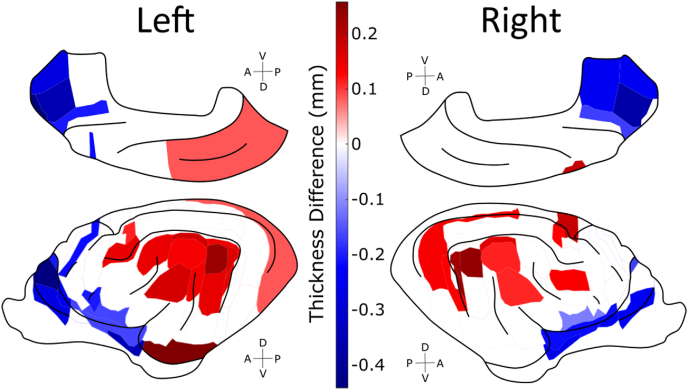
In the absence of hearing, the plastic nature of the cerebral cortex allows select regions to be repurposed to serve the processing of remaining sensory modalities. This plasticity can be observed in many ways, including measuring the thickness differences of cortical gray matter between hearing and deaf populations to detect regional adaptations. In this study, T1-weighted images were acquired for hearing (n = 38) and perinatally-deafened (n = 31) cats using an ultra-high field 7T MRI scanner to identify normative feline cortical thickness, as well as areas of differing thickness between groups. Most significant changes to sensory-related regions demonstrated thicker cortices in the deaf compared to the hearing group, while specific non-sensory regions were found to be thinner. Furthermore, there was a modest lateralized component, finding that the gray matter of the left hemisphere was more susceptible to thickness changes following auditory deprivation. These results suggest distinct factors driving the adaptations in sensory versus non-sensory cortices in the brain following deafness, and reinforces the task-retainment model of crossmodal plasticity.

Keywords: Compensatory crossmodal plasticity; Feline; Gray matter; Sensory cortex; Structural MRI.


Conflict of interest statement

The authors declare that they have no known competing financial interests or personal relationships that could have appeared to influence the work reported in this paper.

Figures

Fig. 1
Fig. 1
Heatmap of regional thickness values in the hearing group. Median thicknesses (mm) of ROIs are visualized on the cat brain, shown from inverted midsagittal (top) and lateral (bottom) perspectives of each hemisphere.
Fig. 2
Fig. 2
Heatmap of regional thickness values in the deaf group. Median thicknesses (mm) of ROIs are visualized on the cat brain, shown from inverted midsagittal (top) and lateral (bottom) perspectives of each hemisphere.
Fig. 3
Fig. 3
Heatmap of regional thickness differences between groups. Median thickness differences (mm) of ROIs are visualized on the cat brain, shown from inverted midsagittal (top) and lateral (bottom) perspectives of each hemisphere. Differences were calculated as deaf minus hearing.
Fig. 4
Fig. 4
Heatmap illustrating only the significant regional thickness differences between groups. Significant (p < 0.05) median thickness differences (mm) of ROIs are visualized on the cat brain, shown from inverted midsagittal (top) and lateral (bottom) perspectives of each hemisphere. Differences were calculated as deaf minus hearing.
Fig. 5
Fig. 5
Scatterplot demonstrating the anticorrelation between hearing group thickness and thickness differences. Individual ROIs are represented by black points, while the line of best fit is drawn in red. Thickness differences were calculated as deaf minus hearing, and the anticorrelation has a Pearson's R of −0.5742 (p = 3.52 × 10−14). (For interpretation of the references to colour in this figure legend, the reader is referred to the Web version of this article.)
Fig. 6
Fig. 6
Median group thickness per modality, along with inter- and intramodal comparisons within and across groups. (A) Bar graph showing group median thickness (mm) ± median absolute deviation (MAD) per modality in each hemisphere, with only the significant differences for within-group intramodal and between-group intramodal-intrahemispheric comparisons indicated. (B) Asymmetric matrix of p-values with the top half corresponding to inter- and intramodal comparisons within the hearing group (green) and the bottom half to the deaf group (red). Group comparisons within modalities are shown on the diagonal (purple). Non-significant values are highlighted in a lighter shade of red, green or purple. (For interpretation of the references to colour in this figure legend, the reader is referred to the Web version of this article.)

Similar articles

References

    1. Almeida J., He D., Chen Q., Mahon B.Z., Zhang F., Gonçalves Ó.F., Fang F., Bi Y. Decoding visual location from neural patterns in the auditory cortex of the congenitally deaf. Psychol. Sci. 2015;26(11):1771–1782. - PMC - PubMed
    1. Angelucci A., Clascá F., Sur M. Brainstem inputs to the ferret medial geniculate nucleus and the effect of early deafferentation on novel retinal projections to the auditory thalamus. J. Comp. Neurol. 1998;400:417–439. - PubMed
    1. Auer E.T., Bernstein L.E., Sungkarat W., Singh M. Vibrotactile activation of the auditory cortices in deaf versus hearing adults. Neuroreport. 2007;18(7):645–648. - PMC - PubMed
    1. Avants B.B., Tustison N., Song G. Advanced normalization tools (ANTS) Insight J. 2014;2(365):1–35.
    1. Barone P., Lacassagne L., Kral A. Reorganization of the connectivity of cortical field DZ in congenitally deaf cat. PLoS One. 2013;8(4) - PMC - PubMed

LinkOut - more resources