. 2025 Jun 11:12:1619559.
doi: 10.3389/fmolb.2025.1619559. eCollection 2025.

Loss of endothelial TRPC1 aggravates metabolic dysfunction in obesity via disrupting adipose tissue homeostasis

Affiliations

Loss of endothelial TRPC1 aggravates metabolic dysfunction in obesity via disrupting adipose tissue homeostasis

Yihui Lan et al. Front Mol Biosci. .

Abstract

Introduction: While obesity exacerbates metabolic disorders through vascular endothelial dysfunction, the specific regulatory mechanisms of endothelial cells underlying this process remain poorly defined. Although the transient receptor potential canonical 1 (TRPC1) channel demonstrates tissue-specific heterogeneity in metabolic regulation, its functional role within endothelial cells and its contribution to metabolic disturbances associated with obesity remain unresolved.

Methods: We established endothelial-specific TRPC1 knockout (TRPC1EC -/-) and overexpression (TRPC1EC KI/KI) mouse models, which were integrated with a high-fat diet (HFD)-induced obesity paradigm. Through comprehensive metabolic phenotyping, adipose tissue molecular profiling, and serum metabolomics analysis, we systematically dissected the regulatory mechanisms of endothelial TRPC1 in glucose and lipid metabolism.

Results: Endothelial TRPC1 deficiency, while not altering the severity of HFD-induced obesity, significantly exacerbates impaired glucose tolerance, insulin resistance, and dyslipidemia. Mechanistically, the deficiency of endothelial TRPC1 enhances the expression of chemokines (CCL3/CXCL5) and pro-inflammatory cytokines (IL-1β/TIMP1), thereby creating an inflammatory microenvironment in epididymal white adipose tissue (eWAT) and suppressing PGC1α/UCP1-mediated thermogenic function. Metabolomic profiling further reveals that TRPC1 deficiency drives systemic metabolic perturbations, including the depletion of serum 1-methylhistidine and N-acetylvaline, alongside the aberrant accumulation of gibberellin A12, which suggests disrupted amino acid metabolism and the activation of non-canonical inflammatory pathways. Conversely, endothelial TRPC1 overexpression significantly ameliorates obesity-associated metabolic dysfunction, as evidenced by reduced visceral fat deposition, enhanced insulin sensitivity, and restored thermogenic capacity in adipose tissue.

Conclusion: This study, for the first time, elucidates the pivotal role of endothelial TRPC1 in maintaining metabolic homeostasis by orchestrating an "inflammation-thermogenesis-metabolite" regulatory network. Specifically, the deficiency of endothelial TRPC1 exacerbates metabolic dysfunction associated with obesity, whereas its overexpression exerts significant protective effects. These findings highlight the centrality of endothelial ion channels in vascular-metabolic coupling, thereby establishing a theoretical rationale for targeting TRPC1 as a therapeutic strategy against metabolic syndrome.

Keywords: TRPC1; endothelial cells; inflammation; metabolic dysfunction; metabolomics; obesity; thermogenesis.


Conflict of interest statement

The authors declare that the research was conducted in the absence of any commercial or financial relationships that could be construed as a potential conflict of interest.

Figures

FIGURE 1
FIGURE 1
Endothelial TRPC1 deficiency does not affect the development of obesity. (A) Schematic of TRPC1EC −/− mouse construction via endothelial cell (EC)-specific Cre-LoxP recombination. (B) Genotyping PCR of TRPC1EC −/− and wild-type mice. (C) Immunofluorescence staining of thoracic aorta in TRPC1fl/fl and TRPC1EC −/− mice: nuclei (DAPI, blue), endothelial marker (CD31, green), and TRPC1 (red). Scale bar: 10 μm. (D) Experimental design for high-fat diet (HFD)-induced obesity model. (E) Body weight trajectories of HFD-fed mice (n = 4–5/group). (F) Representative micro-CT images of adipose tissue distribution in CTL-TRPC1fl/fl, CTL-TRPC1EC −/−, DIO-TRPC1fl/fl, and DIO-TRPC1EC −/− mice (subcutaneous fat: green; visceral fat: yellow). (G) Quantitative micro-CT analysis of subcutaneous and visceral fat volumes across groups (n = 5–7/group). (H) Respiratory exchange ratio (RER) dynamics in CTL mice, quantified by area under the curve (AUC; n = 4–5/group). (I) Heat production of DIO mice via AUC analysis of energy expenditure phases (n = 7–9/group). NS: Not significant (p > 0.05).
FIGURE 2
FIGURE 2
Endothelial TRPC1 deficiency exacerbates obesity-induced dysregulation of glucose and lipid metabolism. (A) Intraperitoneal glucose tolerance test (GTT, 1.5 g/kg) with area under the curve (AUC) analysis for all groups (n = 6/group). (B) Intraperitoneal insulin tolerance test (ITT, 0.75 U/kg) with AUC quantification (n = 6/group). (C–F) Serum levels of total cholesterol (TC), low-density lipoprotein cholesterol (LDL-C), triglycerides (TG), and high-density lipoprotein cholesterol (HDL-C) in four groups (n = 4–6/group). (G) Representative hematoxylin and eosin, (H&E) staining of epididymal white adipose tissue (eWAT) in four groups. Scale bar: 20 μm. (H) Size distribution pattern of adipocytes in eWAT in four groups (n = 5–6/group). *p < 0.05 vs. CTL-TRPC1fl/fl; # p < 0.05 vs. DIO-TRPC1fl/fl; NS: Not significant (p > 0.05).
FIGURE 3
FIGURE 3
Endothelial TRPC1 deficiency exacerbates adipose tissue inflammation and impairs thermogenic gene expression. (A–D) Relative mRNA expression of pro-inflammatory genes in eWAT, mesenteric perivascular adipose tissue (mPVAT), brown adipose tissue (BAT), and aortic perivascular adipose tissue (aPVAT) from DIO-TRPC1fl/fl and DIO-TRPC1EC −/− mice (n = 4–5/group). (E–H) Relative mRNA levels of chemokines/cytokines in the same tissues and mouse groups (n = 4–5/group). (I–L) Relative mRNA expression of thermogenic genes in indicated tissues (n = 4–5/group). (M,N) Representative western blots and quantitative analysis of PGC1α and UCP1 protein levels in eWAT lysates from DIO-TRPC1fl/fl and DIO-TRPC1EC −/− mice (n = 4–5/group). *p < 0.05 vs. DIO-TRPC1fl/fl group.
FIGURE 4
FIGURE 4
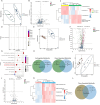
Serum metabolomic alterations induced by endothelial TRPC1 deficiency. (A) Principal component analysis (PCA) separating serum samples from CTL-TRPC1EC −/−(green) and CTL-TRPC1fl/fl (blue) mice (n = 6–10/group). (B) Volcano plot highlighting significantly altered metabolites between CTL-TRPC1EC −/− and CTL-TRPC1fl/fl groups. (C) Correlation heatmap of serum metabolites in CTL-TRPC1EC −/− versus CTL-TRPC1fl/fl mice. (D) Metabolite set enrichment analysis identifying disrupted histidine metabolism in CTL-TRPC1EC −/− mice. (E) PCA distinguishing DIO-TRPC1fl/fl (brown) and CTL-TRPC1fl/fl (blue) serum profiles (n = 9–10/group). (F) Volcano plot of differentially abundant metabolites between DIO-TRPC1fl/fl and CTL-TRPC1fl/fl groups. (G) Pathway enrichment analysis of all significantly altered metabolites in DIO vs. CTL comparison. (H) Venn diagram illustrating overlapping and unique upregulated/downregulated metabolites in CTL-TRPC1EC −/− vs. CTL-TRPC1fl/fl and DIO-TRPC1fl/fl vs. CTL-TRPC1fl/fl comparisons. (I) PCA separating serum samples from DIO-TRPC1EC −/− (blue) and DIO-TRPC1fl/fl (brown) mice (n = 5–10/group). (J) Volcano plot emphasizing significant metabolite alterations in DIO-TRPC1EC −/− vs. DIO-TRPC1fl/fl comparison. (K) Correlation heatmap of serum metabolites in DIO-TRPC1EC −/− versus DIO-TRPC1fl/fl mice. (L) Venn diagram showing commonly downregulated metabolites in DIO-TRPC1EC −/− vs. DIO-TRPC1fl/fl and DIO-TRPC1fl/fl vs. CTL-TRPC1fl/fl comparisons.
FIGURE 5
FIGURE 5
TRPC1 overexpression ameliorates obesity-induced metabolic dysfunction. (A) Schematic diagram illustrating the generation of TRPC1EC KI/KI mice via EC-specific Cre-LoxP recombination. (B) Genotyping PCR validation of TRPC1EC KI/KI and wild-type mice. (C) Immunofluorescence staining of thoracic aorta in TRPC1EC KI/KI and TRPC1fl/fl mice: nuclei (DAPI, blue), endothelial marker (CD31, green), and TRPC1 protein (red). Scale bar: 10 μm. (D) Body weight analysis of 20-week HFD-fed mice: DIO-TRPC1EC KI/KI vs. DIO-TRPC1fl/fl groups (n = 7–8/group). (E) Representative micro-CT images of adipose tissue distribution in DIO-TRPC1EC KI/KI and DIO-TRPC1fl/fl mice (subcutaneous fat: green; visceral fat: yellow). (F) Quantitative micro-CT analysis of subcutaneous and visceral fat volumes in both groups (n = 3–6/group). (G) RER dynamics in DIO-TRPC1EC KI/KI and DIO-TRPC1fl/fl mice, with AUC quantification (n = 5–6/group). (H) GTT (1.5 g/kg) results and AUC values for DIO-TRPC1fl/fl and DIO-TRPC1EC KI/KI mice (n = 5–6/group). (I) ITT (0.75 U/kg) results and AUC calculations for the same groups (n = 5–6/group). (J–M) Serum levels of TC, LDL-C, TG, and HDL-C in DIO-TRPC1fl/fl and DIO-TRPC1EC KI/KI mice (n = 6–7/group). (N) H&E staining of eWAT in both groups (scale bar = 20 μm) and size distribution pattern of adipocytes (n = 5–6/group). (O,P) Representative western blots and quantitative analysis of PGC1α and UCP1 protein levels in eWAT lysates from DIO-TRPC1fl/fl and DIO-TRPC1EC KI/KI mice (n = 4/group). *p < 0.05 vs. DIO-TRPC1fl/fl group; NS: Not significant (p > 0.05).

Similar articles

References

    1. Acharya K. D., Noh H. L., Graham M. E., Suk S., Friedline R. H., Gomez C. C., et al. (2021). Distinct changes in gut microbiota are associated with estradiol-mediated protection from diet-induced obesity in female mice. Metabolites 11 (8), 499. 10.3390/metabo11080499 - DOI - PMC - PubMed
    1. Aladhami A. K., Unger C. A., Ennis S. L., Altomare D., Ji H., Hope M. C., et al. (2021). Macrophage tumor necrosis factor‐alpha deletion does not protect against obesity‐associated metabolic dysfunction. FASEB J. 35 (7), e21665. 10.1096/fj.202100543RR - DOI - PMC - PubMed
    1. Al-Salameh A., Chanson P., Bucher S., Ringa V., Becquemont L. (2019). Cardiovascular disease in type 2 diabetes: a review of sex-related differences in predisposition and prevention. Mayo Clin. Proc. 94 (2), 287–308. 10.1016/j.mayocp.2018.08.007 - DOI - PubMed
    1. Araujo L. C. C., Cruz A. G., Camargo F. N., Sucupira F. G., Moreira G. V., Matos S. L., et al. (2023). Estradiol protects female ApoE KO mice against western-diet-induced non-alcoholic steatohepatitis. Int. J. Mol. Sci. 24 (12), 9845. 10.3390/ijms24129845 - DOI - PMC - PubMed
    1. Asokan S. M., Hung T. H., Chiang W. D., Lin W. T. (2018). Lipolysis-stimulating peptide from soybean protects against high fat diet-induced apoptosis in skeletal muscles. J. Med. Food 21 (3), 225–232. 10.1089/jmf.2017.3941 - DOI - PubMed

LinkOut - more resources