Validity and reproducibility of a web-based dietary assessment tool: a cross-sectional study in an adult Danish population
- PMID: 40568623
- PMCID: PMC12187487
- DOI: 10.1017/jns.2025.10010
Validity and reproducibility of a web-based dietary assessment tool: a cross-sectional study in an adult Danish population
Erratum in
-
Validity and reproducibility of a web-based dietary assessment tool: a cross-sectional study in an adult Danish population - ADDENDUM.J Nutr Sci. 2025 Jul 24;14:e53. doi: 10.1017/jns.2025.10027. eCollection 2025. J Nutr Sci. 2025. PMID: 40735610 Free PMC article. No abstract available.
Abstract
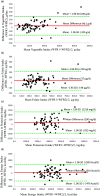
This repeated cross-sectional study assessed the validity and reproducibility of the myfood24® dietary assessment tool against dietary intake biomarkers in healthy Danish adults. The study included 71 healthy adults (14/57 m/f), aged 53.2 ± 9.1 years with an average BMI of 26.1 ± 0.3 kg/m2. Participants were instructed to complete seven-day weighed food records using myfood24® at baseline and 4 ± 1 weeks thereafter. Estimated mean dietary intake was compared with objective measures of energy metabolism and selected dietary intake biomarkers in fasting blood (folate) and in 24-hour urine (urea, potassium). Resting energy expenditure was measured by indirect calorimetry. Application of the Goldberg cut-off classified 87% (n = 62) of participants as acceptable reporters. A strong Spearman's rank correlation was observed between total folate intake and serum folate (ρ = 0.62). Acceptable correlations were noted for serum folate (ρ = 0.49) and urinary potassium excretion (ρ = 0.44) with estimated and measured protein intake (ρ = 0.45); energy intake and total energy expenditure (ρ = 0.38); potassium intake and potassium excretion (ρ = 0.42); and estimated fruit and vegetable intake. Reproducibility analysis revealed strong correlations (ρ ≥ 0.50) across most nutrients and food groups, except for fish and vitamin D (ρ = 0.30 and ρ = 0.26, respectively). Notably, reproducibility for folate and total vegetable intake exhibited the highest correlations (ρ = 0.84 and ρ = 0.78, respectively). In conclusion, while some limitations exist, myfood24® remains a useful tool for ranking individuals by intake, particularly in studies focusing on relative comparisons.
Keywords: 7-day weighed food record; Biomarker; Folate: myfood24®; Protein.
© The Author(s) 2025.
Conflict of interest statement
The author(s) declare none.
Figures

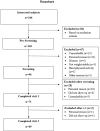
 ), fasting blood samples (
 ), 24-hour urine sample hand-in (
 ), and indirect calorimetry (
 ). Participants completed a 7-day WFR 1 week prior to both visits (
 ), and handed these in (
 ) on both visits. Anthropometric measurements were repeated at Visit 2 (week 5) after a 4 ± 1 week interval.


References
-
- Timon CM, van den Barg R, Blain RJ, et al. A review of the design and validation of web- and computer-based 24-h dietary recall tools. Nutr Res Rev. 2016;29:268–280. - PubMed
-
- Gibson RS. Principles of Nutritional Assessment. New York: Oxford University Press; 2005.
-
- Serra-Majem L, Frost Andersen L, Henríque-Sánchez P, et al. Evaluating the quality of dietary intake validation studies. Br J Nutr. 2009;102:S3–S9. - PubMed
Publication types
MeSH terms
Substances
LinkOut - more resources
Full Text Sources

