

This is a preprint.
Predictive performance of wearable sensors for mortality risk in older adults: a model development and validation study
- PMID: 40568664
- PMCID: PMC12191095
- DOI: 10.1101/2025.04.03.25325101
Predictive performance of wearable sensors for mortality risk in older adults: a model development and validation study
Abstract
Background: Many adults in high-income countries carry a device capable of measuring physical-activity behaviour. Thus, there is public health need to understand whether such data can enhance prediction of future health outcomes. We aimed to investigate whether device-measured daily-step count and walking cadence improve the prediction of mortality beyond traditional risk-factors.
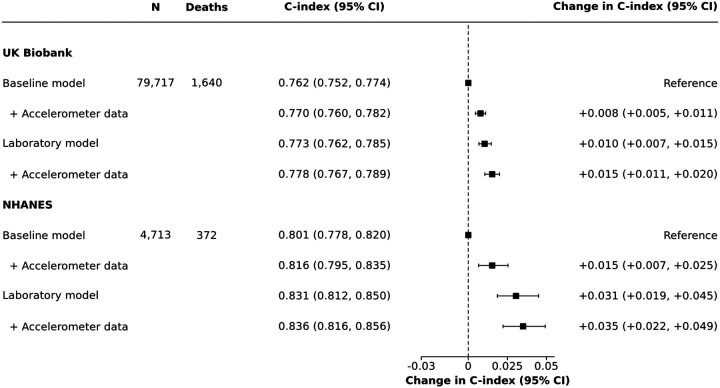
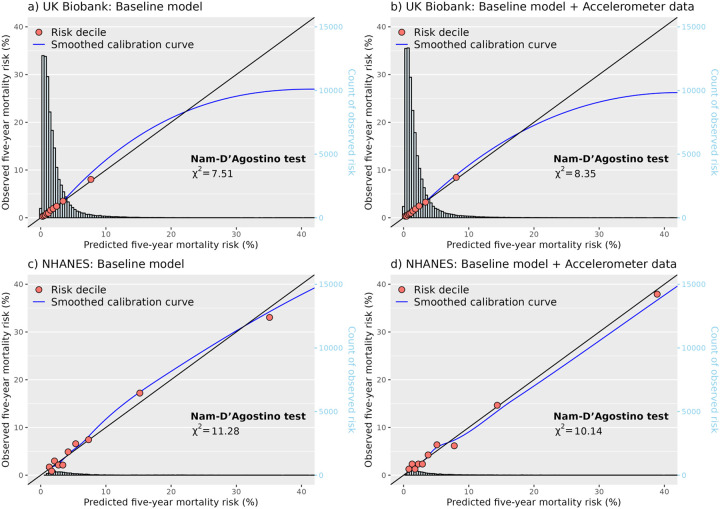
Methods: Risk models were developed to predict five-year all-cause mortality using data from the UK Biobank accelerometer sub-study, with external validation in the US 2011-2014 National Health and Nutrition Examination Survey (NHANES). Median daily-step count and peak one-minute walking cadence were derived using self-supervised machine learning models from seven-day wrist-worn accelerometer data. Cox models were used to develop a baseline model incorporating traditional risk-factors, and a baseline model plus accelerometer data (i.e. daily-steps and walking cadence). Changes in model performance were assessed using Harrell's C-index, net reclassification index (NRI; 10% threshold), and the Nam-D'Agostino calibration test.
Findings: Among 79,717 UK Biobank participants, 1,640 died within 5-years. Adding accelerometer data to the baseline model modestly improved risk discrimination and classification with a change in c-index of 0.008 (95% confidence interval [CI] 0.005-0.011) and 3.3% NRI (95%CI 2.1%-4.5%). Greatest improvements in prediction were observed in participants with prior disease at baseline, showing a change in c-index of 0.028 (95%CI 0.019-0.039) and 5.9% NRI (95%CI 3.1%-8.6%). In the NHANES external validation cohort (n=4,713; deaths=378), similar improvements in prediction were observed (change in c-index: 0.015, 95%CI 0.007-0.025; NRI: 4.0%, 95%CI 0.7%-7.4%). All models were well calibrated (Nam-D'Agostino χ2 range: 6.8-13.2).
Interpretation: Device-measured daily-step count and walking cadence consistently demonstrated modest improvements in predicting mortality risk beyond traditional risk-factors, with the most significant enhancements seen in individuals with prior disease. These findings suggest that incorporating information from wearables does provide important new ways to improve risk stratification for targeted intervention in high-risk individuals.
Keywords: accelerometer; mortality; physical activity; risk prediction; step count.
Conflict of interest statement
AD is supported by the Wellcome Trust (223100/Z/21/Z, 227093/Z/23/Z), Novo Nordisk, Swiss Re, and the British Heart Foundation Centre of Research Excellence (RE/18/3/34214); has accepted consulting fees from the University of Wisconsin (NIH R01 grant) and Harvard University (NIH R01 grant); received support for presentations or attendance at several conferences; and has received a donation from Swiss Re for accelerometer data collection in the China Kadoorie Biobank. AS is supported by the National Institutes of Health’s Intramural Research Program and National Institutes of Health’s Oxford Cambridge Scholars Program. ADS is supported by the Engineering and Physical Sciences Research Council. BM is supported by the Wellcome Trust [223100/Z/21/Z] and Swiss Re. CH is supported by Swiss Re and Novo Nordisk. DB is supported by Novo Nordisk, Swiss Re, and the Medical Research Council Population Health Research Unit. SC is supported by Novo Nordisk. DM, PP, JS, and AS are employed by Swiss Re.
Figures
References
-
- Arnett DK, Blumenthal RS, Albert MA, et al. 2019 ACC/AHA Guideline on the Primary Prevention of Cardiovascular Disease. J Am Coll Cardiol 2019; 74: e177–232.
Publication types
Grants and funding
LinkOut - more resources
Full Text Sources