

Estimating undiagnosed HIV infections by age group in Japan: an extended age-dependent back-calculation
- PMID: 40568685
- PMCID: PMC12191302
- DOI: 10.1016/j.idm.2025.06.001
Estimating undiagnosed HIV infections by age group in Japan: an extended age-dependent back-calculation
Abstract
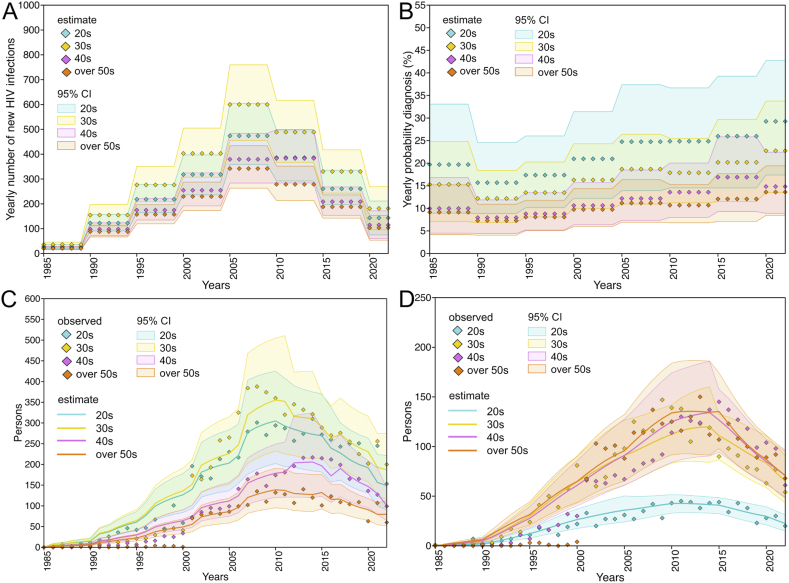
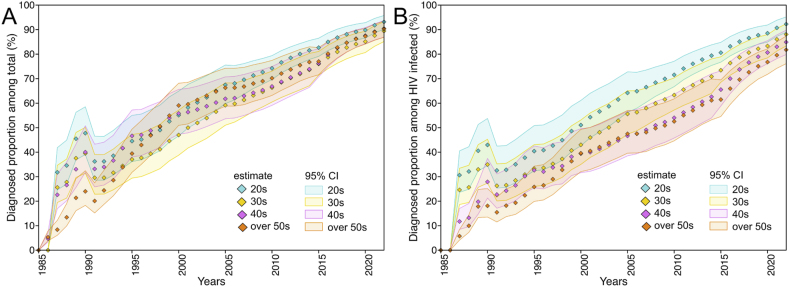
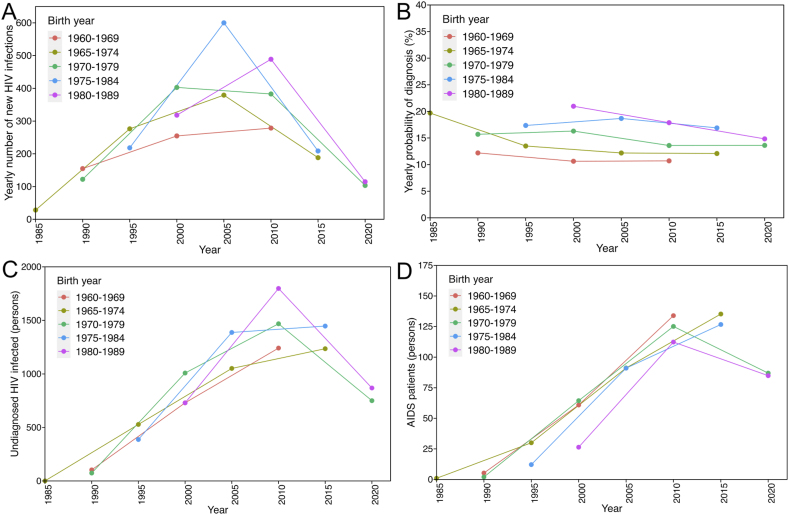
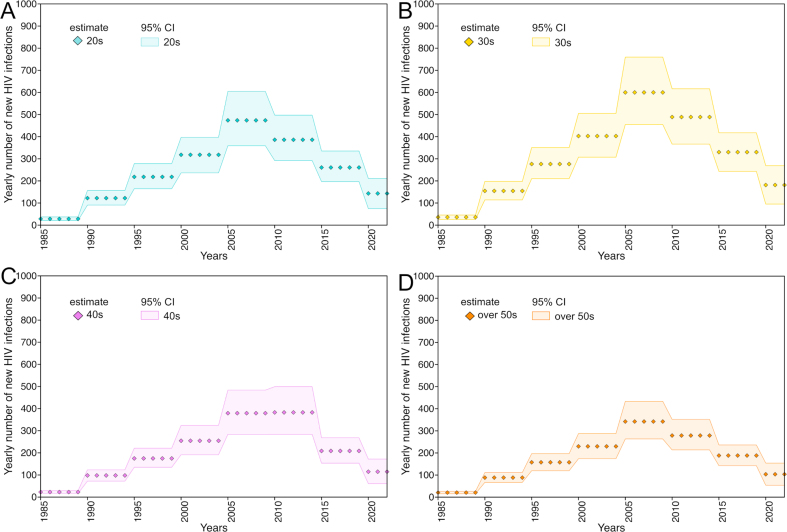
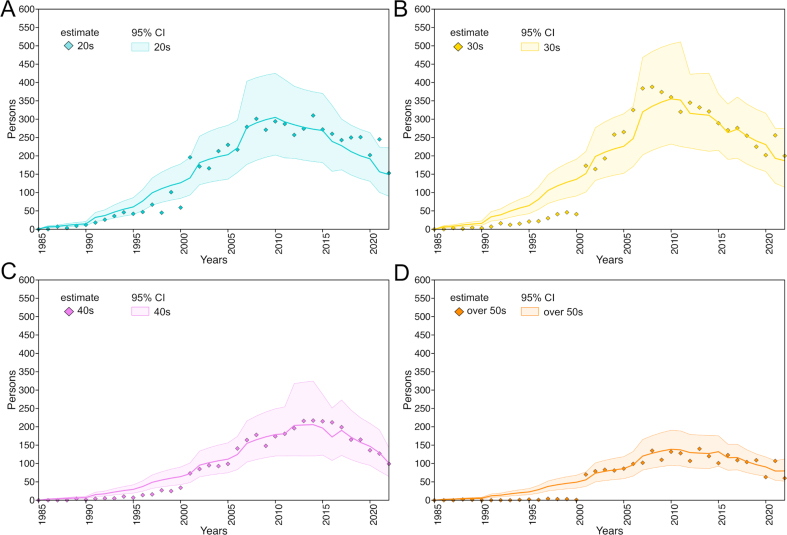
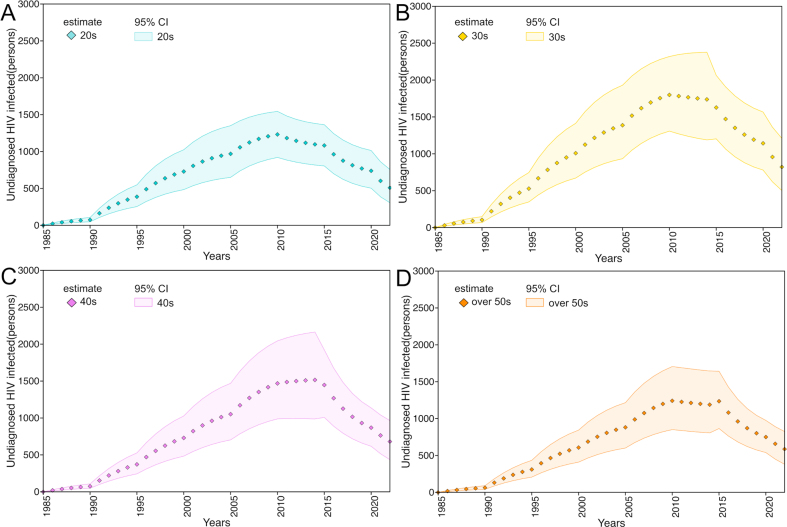
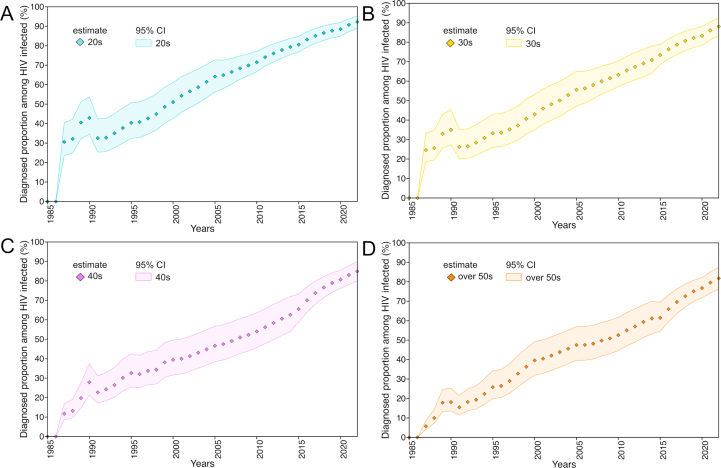
Understanding the number of undiagnosed HIV-infected individuals by age is essential for improving the test-and-treat strategy. We developed an extended back-calculation by age group to investigate the situation in Japan, describing the data-generating process of AIDS cases and HIV diagnoses as a function of age and time. We considered the incubation period as a function of both age and time since infection, and estimated the number of new HIV infections and annual diagnosis rate by age and time. The diagnosed proportion of HIV infections at the end of 2022 was estimated to be 93.2 % (95 % CI: 90.2, 95.8) in their 20s, 90.4 % (95 % CI: 87.0, 93.7) in their 40s, 90.3 % (95 % CI: 86.9, 93.5) in their 50s or older, and 89.4 % (95 % CI: 85.1, 93.2) in their 30s. The annual rate of diagnosis of people in their 40s decreased from 16.9 % in 2015-2019 to 14.8 % in 2020-22. Despite increasing trend in diagnostic rate, the estimate for those in their 50s was as small as 13.6 % (95 % CI: 8.5, 19.4) in 2020-2022. We identified a difficulty in diagnosing HIV-infected individuals aged 40 and older. The absolute number of infections is greater among those in their 30s than 40s, but the AIDS incidence is the opposite, suggesting that older individuals would require more customized (and easy to access) opportunities for diagnosis.
Keywords: Antiretroviral therapy; Ascertainment; Retrovirus; Test-and-treat; Treatment as prevention; U=U.
© 2025 The Authors.
Conflict of interest statement
The authors declare that they have no known competing financial interests or personal relationships that could have appeared to influence the work reported in this paper.
Figures


Similar articles
-
Antiretrovirals for reducing the risk of mother-to-child transmission of HIV infection.Cochrane Database Syst Rev. 2011 Jul 6;(7):CD003510. doi: 10.1002/14651858.CD003510.pub3. Cochrane Database Syst Rev. 2011. PMID: 21735394
-
Antiretrovirals for reducing the risk of mother-to-child transmission of HIV infection.Cochrane Database Syst Rev. 2007 Jan 24;(1):CD003510. doi: 10.1002/14651858.CD003510.pub2. Cochrane Database Syst Rev. 2007. Update in: Cochrane Database Syst Rev. 2011 Jul 06;(7):CD003510. doi: 10.1002/14651858.CD003510.pub3. PMID: 17253490 Updated.
-
Aerobic exercise interventions for adults living with HIV/AIDS.Cochrane Database Syst Rev. 2005 Apr 18;(2):CD001796. doi: 10.1002/14651858.CD001796.pub2. Cochrane Database Syst Rev. 2005. Update in: Cochrane Database Syst Rev. 2010 Aug 04;(8):CD001796. doi: 10.1002/14651858.CD001796.pub3. PMID: 15846623 Updated.
-
Behavioral interventions to reduce risk for sexual transmission of HIV among men who have sex with men.Cochrane Database Syst Rev. 2008 Jul 16;(3):CD001230. doi: 10.1002/14651858.CD001230.pub2. Cochrane Database Syst Rev. 2008. PMID: 18646068
-
Progressive resistive exercise interventions for adults living with HIV/AIDS.Cochrane Database Syst Rev. 2004 Oct 18;(4):CD004248. doi: 10.1002/14651858.CD004248.pub2. Cochrane Database Syst Rev. 2004. PMID: 15495092
References
-
- AIDS Prevention Information Network Annual report on HIV/AIDS trends in Japan, 2022. 2023. https://api-net.jfap.or.jp/status/japan/nenpo2022.html Retrieved from.
-
- AIDS Prevention Information Network Analysis results of AIDS incidence trends in the 4th year of Reiwa. 2023. https://api-net.jfap.or.jp/status/japan/data/2022/nenpo/bunseki.pdf (2022). Retrieved from.
-
- Becker N.G., Marschner I.C. A method for estimating the age-specific relative risk of HIV infection from AIDS incidence data. Biometrika. 1993;80(1):165–178. doi: 10.2307/2336766. - DOI
-
- Brauer F., Castillo-Chavez C. Springer; 2012. Mathematical models in population biology and epidemiology.
LinkOut - more resources
Full Text Sources
