. 2025 Jul 29;97(29):15562-15569.
doi: 10.1021/acs.analchem.4c04141. Epub 2025 Jun 26.

Top-Down Proteomics for the Characterization and Quantification of Calreticulin Arginylation

Affiliations

Top-Down Proteomics for the Characterization and Quantification of Calreticulin Arginylation

Richard M Searfoss et al. Anal Chem. .

Abstract

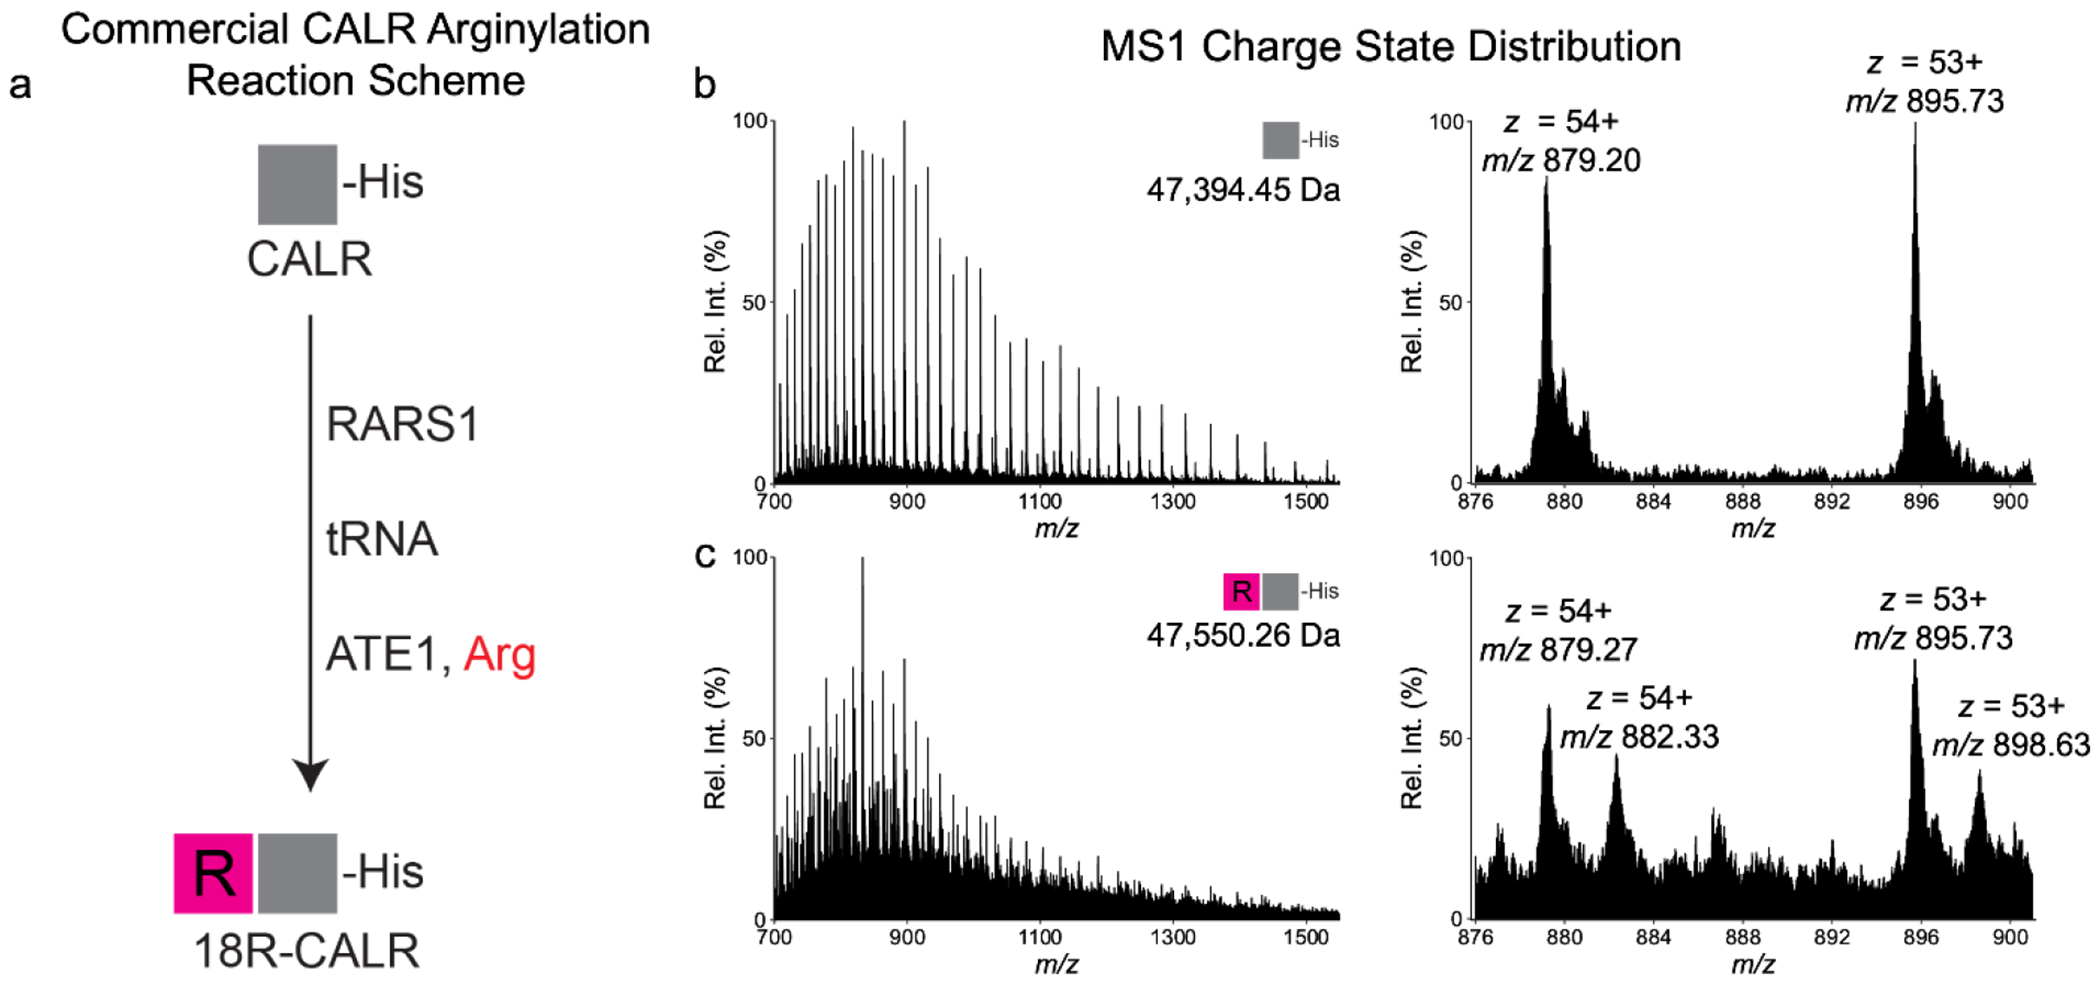
Arginylation installed by arginyltransferase 1 (ATE1) features an addition of arginine (Arg) to the reactive amino acids (e.g., Glu and Asp) at the protein N-terminus or side chain. Systemic removal of arginylation after ATE1 knockout (KO) in mouse models resulted in heart defects leading to embryonic lethality. The biological importance of arginylation has motivated the discovery of arginylation sites on proteins using bottom-up approaches. While bottom-up proteomics is powerful in localizing peptide arginylation, it lacks the ability to quantify proteoforms at the protein level. Here we developed a top-down proteomics workflow for characterizing and quantifying calreticulin (CALR) arginylation. To generate fully arginylated CALR (R-CALR), we have inserted an R residue after the signaling peptide (AA1-17). Upon overexpression in ATE1 KO cells, CALR and R-CALR were purified by affinity purification and analyzed by LCMS in positive mode. Both proteoforms showed charge states ranging from 27 to 68 with charge 58 as the most intense charge state. Their MS2 spectra from electron-activated dissociation (EAD) showed preferential fragmentation at the protein N-terminals which yielded sufficient c ions facilitating precise localization of the arginylation sites. The calcium-binding domain (CBD) gave minimum characteristic ions possibly due to the abundant presence of >100 D and E residues. Ultraviolet photodissociation (UVPD) compared with EAD and ETD significantly improved the sequence coverage of CBD. This method can identify and quantify CALR arginylation at absence, endogenous (low), and high levels. To our knowledge, our work is the first application of top-down proteomics in characterizing post-translational arginylation in vitro and in vivo.


Figures

Figure 1.
Figure 1.
Affinity pulldown and purification of CALR and R-CALR proteins. a, schematic for design and purification strategies of CALR proteins. b, gel visualization of overexpression and purified CALR proteins. Proteins with and without Halo tag were shown with different molecular weights on gels.
Figure 2.
Figure 2.
MS1 and MS2 characterization of CALR and R-CALR proteins. a, Top-down proteomics workflow used for characterizing intact calreticulin using a C4-reversed phase separation chromatographic gradient. b, MS1 charge state distribution and measured monoisotopic and average masses of CALR and R-CALR shown as an average scan across the chromatographic peak. Visualization of the MS1 mass shift incurred by adding an arginine residue to the N-terminus, focusing on charge state +58. c, MS2 sequence coverage of CALR and R-CALR when subjected to EAD fragmentation.
Figure 3.
Figure 3.
MS1 Label-free quantitation of CALR and R-CALR in mixed populations. a, XIC of the [M+58H]58+ charge state of unmodified CALR, representing an increasing quantity in each sequential experiment, and XIC of the [M+58H]58+ charge state of modified R-CALR, representing a decreasing quantity in each sequential experiment. b, The percent of the total calreticulin signal measured in each experiment represented by either CALR or R-CALR. The total calreticulin signal was calculated by XIC of twenty charge states of each species and summing their chromatographic peak areas.
Figure 4.
Figure 4.
Identification of endogenously arginylated calreticulin in the presence of co-overexpressed ATE1 enzyme on the ZenoTOF 7600. a, EAD MS2 spectra confirming the absence of N-terminal arginylation in the control sample, as indicated by the lack of the c3 ion (m/z 400.23), and confirming the presence of N-terminal arginylation, indicated by the low-level presence of the c1 ion after transient expression of ATE1 enzyme in samples 2-4 and high signal in sample 5. b, The percent signal of R-CALR from the total MS1 calreticulin signal, calculated from XIC of three charge states of each species.
Figure 5.
Figure 5.
Proof of concept of in vitro arginylation assay for identification of endogenous arginylation events. a, Reaction scheme of RARS1 charging the R-tRNA, followed by incubation with ATE1 and CALR to allow N-terminal installation of the arginyl modification. b, MS1 charge state distribution and measured monoisotopic mass of commercial CALR shown as an average scan across the chromatographic peak, and a focused view of m/z 876-900 to visualize unmodified CALR peaks. c, MS1 charge state distribution from ion trap and measured monoisotopic mass of commercial CALR after ATE1 installation of arginyl modification, shown as an average scan across the chromatographic peak. The focused view of m/z 876-900 allows visualization of mass shift compared to the unmodified CALR peaks.
Figure 6.
Figure 6.
Proof of concept of on-bead in vitro arginylation assay for identification of endogenous arginylation events. a, Calreticulin arginylation scheme using Halo-tag purified calreticulin and light or heavy arginine. Samples started with the same lysate and were then purified and arginylated separately. b, MS1 charge state z = 59+ shows mass shift of CALR to R0-CALR, and XIC of three charge states shows arginylation efficiency of 60.3%. c, MS1 charge state z = 59+ shows mass shift of CALR to R10-CALR, and XIC of three charge states shows arginylation efficiency of 73.8%. d, MS2 spectra confirms N-terminal installation of R0 modification with signature c1 ion (m/z 174.13). e, MS2 spectra confirms N-terminal installation of R10 modification with signature c1 ion (m/z 184.14), and a shift of 10 Da of all c-ions from the R0 spectra shown above.

Update of

References

    1. Heo AJ; Kim SB; Kwon YT; Ji CH The N-degron pathway: From basic science to therapeutic applications. Biochim Biophys Acta Gene Regul Mech 2023, 1866 (2), 194934. DOI: 10.1016/j.bbagrm.2023.194934 - DOI - PubMed
    1. Varshavsky A N-degron and C-degron pathways of protein degradation. Proc Natl Acad Sci U S A 2019, 116 (2), 358–366. DOI: 10.1073/pnas.1816596116 - DOI - PMC - PubMed
    1. Lee MJ; Tasaki T; Moroi K; An JY; Kimura S; Davydov IV; Kwon YT RGS4 and RGS5 are in vivo substrates of the N-end rule pathway. Proc Natl Acad Sci U S A 2005, 102 (42), 15030–15035. DOI: 10.1073/pnas.0507533102 - DOI - PMC - PubMed
    1. Yoo YD; Mun SR; Ji CH; Sung KW; Kang KY; Heo AJ; Lee SH; An JY; Hwang J; Xie XQ; Ciechanover A; Kim BY; Kwon YT N-terminal arginylation generates a bimodal degron that modulates autophagic proteolysis. Proc Natl Acad Sci U S A 2018, 115 (12), E2716–E2724. DOI: 10.1073/pnas.1719110115 - DOI - PMC - PubMed
    1. Saha S; Kashina A Posttranslational arginylation as a global biological regulator. Dev Biol 2011, 358 (1), 1–8. DOI: 10.1016/j.ydbio.2011.06.043 - DOI - PMC - PubMed