. 2025 Sep;12(36):e14477.
doi: 10.1002/advs.202414477. Epub 2025 Jun 26.

RIG-I-Inducing Small Molecules Potently Inhibit HMA-Resistant AML Through Igniting the Overloaded dsRNA Arsenal

Affiliations

RIG-I-Inducing Small Molecules Potently Inhibit HMA-Resistant AML Through Igniting the Overloaded dsRNA Arsenal

Xueqin Chen et al. Adv Sci (Weinh). 2025 Sep.

Abstract

DNA hypomethylating agents (HMAs) are widely used to treat acute myeloid leukemia (AML)/myelodysplastic syndrome (MDS), but most treated patients relapse and lack standard treatment options. Using high-throughput screening, the approved all-trans retinoic acid (ATRA) is identified that exhibit high selectivity in killing HMA-resistant AML cells compared to parental cells. Mechanistically, HMA-resistant cells are overloaded with DNA hypomethylation-associated endogenous viral double-stranded RNA (dsRNA) which, however, fails to trigger an anticancer interferon (IFN) immune response due to downregulation of dsRNA sensor retinoic acid-inducible gene I (RIG-I). ATRA compensates for RIG-I expression, thereby re-triggering IFN response and potently inhibiting HMA-resistant AML cell lines, xenograft mice, and patient-derived primary cells. A library of potential RIG-I-inducing compounds is rationally constructed and screened, in which the approved M3 AML treatment drug tamibarotene (TAM) exhibits strikingly 28036-fold selectivity and 779 pm IC50 in killing HMA-resistant AML cells. ATRA and TAM do not selectively inhibit p53-mutant cancer cells. Together, this study uncovers a common resistance mechanism in HMA-treated AML patients and, in addition, provides highly potent and selective agents that can overcome resistance through re-triggering IFN anticancer immune response.

Keywords: RIG‐I; acute myeloid leukemia; anticancer immune response; hypomethylating agent; interferon.


Conflict of interest statement

The authors declare no conflict of interest.

Figures

Figure 1
Figure 1
High‐throughput screening identified ATRA as a potent and selective inhibitor of HMA‐resistant AML cells. A) Schematic overview of high‐throughput screening in native and DAC‐resistant THP‐1 cells. Cells were seeded in 384‐well plates and treated with 1898 FDA‐approved drugs at a screening concentration of 1 µm for 5 days. Cell viability was measured for comparison between the two cell lines. B,C) Cell viability of drug‐treated parental (B) and DAC‐resistant (C) THP‐1 cell lines. Drugs are ranked according to cell viability. D) Fold change (FC) of cell viability between the two cell lines for each screened drug. Drugs were ranked according to FC. E,F) The indicated cells were treated with increasing doses of ATRA for 72 h, followed by determination of cell viability. IC50 values were calculated using non‐linear curve fitting in GraphPad Prism 8.0. The IC50 shift (fold) was calculated. G) Phase‐contrast images of the indicated cells treated with 1 µm ATRA for 72 h. Scale bar, 50 µm. Error bars represent mean ± SD (n = 3 biological replicates).
Figure 2
Figure 2
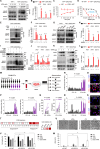
Downregulated RIG‐I fails to trigger IFN anticancer immune response in HMA‐resistant AML. A) Schematic illustration of the IFN immune positive feedback response triggered by HMA through DNA demethylation, dsRNA overloading and detection by dsRNA sensors. B) COBRA‐LINE‐1 determination of global DNA methylation levels in the indicated cells. The signal density of unmethylated and methylated DNA was quantified using ImageJ in the lower panel. C) The indicated cells were treated the indicated compounds with two replicates, followed by RNA‐seq. Heatmap shows the relative expression levels of DAC‐induced dsRNAs (fold change > 2 and P < 0.05 in DAC‐treated parental THP‐1 cells compared to untreated parental cells, n = 74) in parental and DAC‐resistant THP‐1 cells. For each dsRNA, expression is normalized to the mean level of the two DAC‐untreated parental THP‐1 samples. D) qRT‐PCR determination of mRNA levels of dsRNAs in the indicated THP‐1 cells. E) Heatmap showing relative expression levels of genes involved in IFN‐α response (hallmark gene sets). RNA‐seq data are derived from (C). F) qRT‐PCR determination of mRNA levels of the indicated ISGs in the indicated THP‐1 cells after 1 µm DAC treatment for 72 h. G) The indicated THP‐1 cells were treated with increasing doses of IFN‐α or IFN‐β for 72 h, followed by determination of cell viability. H) Promoter methylation level detected by bisulfite sequencing in the indicated cells. I,J) Methylation‐specific PCR detecting the indicated promoters in the indicated cells (I) or in THP‐1 cells treated with the IC90 dose of DAC for 0–3 months (J). U, unmethylated alleles; M, methylated alleles. K) qRT‐PCR determination of mRNA levels of dsRNA sensors in the indicated cells. L) Immunoblotting of RIG‐I and MAVS protein levels in the indicated cells. M) Immunoblotting of the indicated proteins in the indicated cells treated with DAC for 24 h. Cell mitochondria were isolated for semi‐denaturing detergent agarose gel electrophoresis (SDD‐AGE), and whole‐cell lysates were used for SDS‐PAGE. N,O) Dose‐response curves (bottom) on DAC of RIG‐I‐knockdown (N) or RIG‐I‐overexpressed (O) THP‐1 cells, immunoblotting (top) of RIG‐I is shown. P) Schematic of the experiments designed to investigate RIG‐I expression and sensitivity to HMA in primary PBMCs. PB was collected from 15 diagnosed AML patients and 5 AML patients who relapsed after HMA (DAC or AZA) treatment, followed by PBMC isolation, tissue culture and the designed determinations. The cultured PBMCs from relapsed patients were treated with the HMA (DAC or AZA) corresponding to that used in the patients in the clinics. Q) qRT‐PCR determination of RIG‐I in the indicated primary PBMCs. R) RIG‐I immunostaining for the primary PBMCs derived from the representative diagnosed patient #2 and relapsed patient #16. S–X) The cultured PBMCs were treated with 1 µm HMA for 72 h, followed by the designed determinations. S) qRT‐PCR determination of IFNA1 and IFNB1. T) Culture medium was collected and assayed by ELISA for IFN‐α and IFN‐β secretion. U) qRT‐PCR determination of MX1. V) MX1 immunostaining of representative primary PBMCs. W) The indicated cells were counted visually under a microscope and the percentage of cell inhibition was color‐coded by quartile. X) Phase‐contrast images of the indicated representative primary PBMCs. PT, patient. H, healthy people. FC, fold change. Scale bar, 50 µm. Error bars represent mean ± SD (n = 3 biological replicates, *P < 0.05, **P < 0.01, ***P < 0.001).
Figure 3
Figure 3
ATRA compensates for RIG‐I expression and re‐triggers IFN anticancer immune response in HMA‐resistant AML. A) Immunoblotting of the indicated proteins in the indicated cells treated with ATRA for 24 h by SDD‐AGE and SDS‐PAGE. B) qRT‐PCR determination of the mRNA levels of the indicated ISGs in the indicated cells after treatment with 1 µm ATRA for 72 h. C) The indicated cells were pretreated with increasing doses of AR7 for 4 h, and then treated with or without 1 µm ATRA for 72 h, followed by determination of cell viability. D) The indicated cells were treated with increasing doses of AM580 for 72 h, followed by determination of cell viability. E,F) The indicated cells were pretreated with 10 µm AR7 for 4 h, followed by treatment with 1 µM ATRA for 24 h and immunoblotting (E) or treatment with 1 µm ATRA for 72 h and qRT‐PCR determination (F). G,H) The indicated cells were cultured, followed by treatment with 1 µm ATRA or AM580 for 24 h and immunoblotting (G) or treatment with 1 µm AM580 for 72 h and qRT‐PCR determination (H). I,J) The indicated cells were transfected with siRNA targeting RARα for 24 h and then treated with 1 µm ATRA for 48 h, followed by immunoblotting (I) and qRT‐PCR determination (J). K,L) Cells were transfected with empty vector or plasmid encoding RARα for 48 h, followed by immunoblotting (K) and qRT‐PCR determination (L). M) Schematic of the experiments designed to investigate the sensitivity of primary PBMCs to ATRA. N–U) The cultured PBMCs were treated with 1 µm ATRA for 72 h, followed by the designed experiments. N) qRT‐PCR determination of RIG‐I. O) RIG‐I immunostaining of two representative samples. P) qRT‐PCR determination of IFNA1 and IFNB1. Q) Supernatants were collected and assayed by ELISA for IFN‐α and IFN‐β production. R) qRT‐PCR determination of MX1. S) MX1 immunostaining of two representative samples. T) The indicated cells were counted visually under a microscope and the percentage of cell inhibition was colour‐coded by quartile. U) Phase‐contrast images of the indicated primary PBMCs. V,W) The indicated SJSA‐1 cells with different p53 status, generated via CRISPR genome‐editing technology, were treated with 1 µm DAC and 10 µm ATRA for 72 h, followed by determination of cell viability (V) and qRT‐PCR determination (W). PT, patient. FC, fold change. Scale bar, 50 µm. Error bars represent mean ± SD (n = 3 biological replicates, **P < 0.01, ***P < 0.001).
Figure 4
Figure 4
ATRA prolongs survival of HMA‐resistant AML xenograft mice by re‐triggering IFN anticancer immune response. A,B) Schematic of the xenograft study on survival observation. A) NCG mice were inoculated with DAC‐resistant THP‐1 cells via the tail vein (i.v.) on day ‐7. Mice were treated with vehicle, DAC or ATRA intraperitoneally (i.p.) daily from day 0 until death. There were 8 mice in each group. B) Kaplan‐Meier survival curves for the mice in (A). The Log‐rank (Mantel‐Cox) test was used to compare survival between groups in GraphPad Prism 8.0. C–H) Schematic of the xenograft study on disease progression. C) Mice were treated as in (A), except that mice were sacrificed on day 17 and the spleens and PB were harvested for the designed experiment. D) Photograph of the spleens harvested on day 17. E) The weight of the harvested spleens. F) Flow cytometric analysis of the percentage of human CD45‐positive cells (the transplanted DAC‐resistant THP‐1 cells) in the harvested PB. G) Blood counts in the harvested PB. WBC, white blood cells. RBC, red blood cells. HGB, hemoglobin. HCT, hematocrit. PLT, platelets. H) qRT‐PCR determination of the indicated genes in the harvested PB and spleens. FC, fold change. NS, not significant. Error bars represent mean ± SD (n = 3 biological replicates, *P < 0.05, **P < 0.01, ***P < 0.001).
Figure 5
Figure 5
Rational identification of small molecules that kill HMA‐resistant AML cells with super potency and selectivity. A) Workflow of library construction of potential RIG‐I‐inducing small molecules. The 54 commercially available small molecules predicted to bind RARα with high affinity (< −8.0 kcal mol−1) in 1‐click Docking and the 48 commercially available small molecules with high structural similarity to the known type I RARα agonists TAM, AM580, tazarotene and adapalene or type II RARα agonists peretinoin, isotretinoin, ATRA and acitretin (Tanimoto score > 0.3) were collected to form the library. B) Schematic overview of compound screening in parental and DAC‐resistant AML cells. Cells were seeded in 384‐well plates and treated with the small molecules from the constructed library in (A) at a screening concentration of 1 or 0.1 µm for 5 days. Cell viability was measured for comparison between the two cell lines. Cpds, compounds. C–E) Results of the screening performed with 1µm compound. C,D) Cell viability of compound‐treated parental (C) and DAC‐resistant (D) THP‐1 cell lines. Compounds are ranked by cell viability. E) FC of cell viability between the two cell lines for each screened drug. Drugs were ranked according to FC. The compounds with higher selectivity than ATRA between the two cell lines are shown as red bars or dots. F) Dot plot comparing FC of cell viability in parental versus DAC‐resistant THP‐1 cells. The viability data were derived from the screening studies using 1 and 0.1 µm compounds. r is Pearson's correlation coefficient. G) Summarized IC50 values and IC50 shift (fold) treated with the indicated compounds in the two indicated cell lines. H,I) Chemical structures of TAZA (H) and TAM (I) and their dose response in the two indicated cell lines. The IC50 shift (fold) was calculated. J–M) PBMCs from 20 diagnosed and relapsed AML patients were treated with 1 µm TAZA or TAM for 72 h, followed by the designed experiments. J) The indicated cells were counted visually under a microscope and the percentage of cell inhibition was color‐coded by quartile (top). Genetic mutations and the subtypes of AML were depicted (bottom). For calculating the correlation between the response rate to TAM and the indicated genetic mutations, Fisher's exact test was used and the corresponding P‐values were shown in the right panel. NGS, next‐generation sequencing. WT, wild‐type. Mut, mutant. NA, not available. P‐val, P‐value. K) Phase‐contrast images of representative primary PBMCs. Scale bar, 50 µm. L,M) Culture medium was collected and assayed by ELISA for IFN‐α (L) and IFN‐β (M) production. PT, patient. FC, fold change. Error bars represent mean ± SD (n = 3 biological replicates).
Figure 6
Figure 6
Proposed mechanism underlying how RIG‐I‐inducing agents potently kill HMA‐resistant AML. In diagnosed AML patients, cancer cells remain in a state of DNA hypermethylation and low‐level dsRNA (the first panel). HMA induces DNA hypomethylation, leading to dsRNA overload (bomb icon), which is sensed by RIG‐I (match icon) and triggers IFN anticancer immune response (the second panel). In patients relapsed after HMA treatment, the dsRNA arsenal fails to trigger IFN immune response due to downregulation of RIG‐I (the third panel). Treatment with RIG‐I‐inducing agents, such as ATRA and TAM, compensates for expression of RIG‐I and re‐triggers IFN immune response (the last panel).

References

    1. Roulois D., Loo Yau H., Singhania R., Wang Y., Danesh A., Shen S. Y., Han H., Liang G., Jones P. A., Pugh T. J., O'Brien C., De Carvalho D. D, Cell 2015, 162, 961. - PMC - PubMed
    1. Chiappinelli K. B., Strissel P. L., Desrichard A., Li H., Henke C., Akman B., Hein A., Rote N. S., Cope L. M., Snyder A., Makarov V., Budhu S., Slamon D. J., Wolchok J. D., Pardoll D. M., Beckmann M. W., Zahnow C. A., Merghoub T., Chan T. A., Baylin S. B., Strick R., Cell 2015, 162, 974. - PMC - PubMed
    1. Leonova K. I., Brodsky L., Lipchick B., Pal M., Novototskaya L., Chenchik A. A., Sen G. C., Komarova E. A., Gudkov A. V., Proc. Natl. Acad. Sci. USA 2013, 110, E89. - PMC - PubMed
    1. Welch J. S., Petti A. A., Miller C. A., Fronick C. C., O'Laughlin M., Fulton R. S., Wilson R. K., Baty J. D., Duncavage E. J., Tandon B., Lee Y. S., Wartman L. D., Uy G. L., Ghobadi A., Tomasson M. H., Pusic I., Romee R., Fehniger T. A., Stockerl‐Goldstein K. E., Vij R., Oh S. T., Abboud C. N., Cashen A. F., Schroeder M. A., Jacoby M. A., Heath S. E., Luber K., Janke M. R., Hantel A., Khan N., et al., The New England J. Med. 2016, 375, 2023. - PMC - PubMed
    1. Stomper J., Rotondo J. C., Greve G., Lubbert M., Leukemia 2021, 35, 1873. - PMC - PubMed

MeSH terms

LinkOut - more resources