. 2025 Aug;12(31):e07210.
doi: 10.1002/advs.202507210. Epub 2025 Jun 26.

Rapamycin Alleviates Heart Failure Caused by Mitochondrial Dysfunction and SERCA Hypoactivity in Syntaxin 12/13 Deficient Models

Affiliations

Rapamycin Alleviates Heart Failure Caused by Mitochondrial Dysfunction and SERCA Hypoactivity in Syntaxin 12/13 Deficient Models

Run-Zhou Yang et al. Adv Sci (Weinh). 2025 Aug.

Abstract

SYNTAXIN 12/13 (STX12), a member of the syntaxin protein family enriched in the brain and heart, plays important roles in vesicle recycling. Currently, the role of STX12 in cardiovascular physiology remains unclear. Using zebrafish and mice, it is shown that STX12 loss leads to pericardial edema, cardiac malformations, and heart failure. Stx12 depletion disrupts mitochondrial morphology, reduces iron and zinc levels, and impairs ATP production. Stx12-deficient cardiomyocytes exhibit prolonged repolarization due to decreased sarcoplasmic reticulum Ca2+-ATPase (SERCA) activity. Treatment with rapamycin, an mTOR inhibitor, restores mitochondrial protein expression and function by prompting the TFEB-PGC1α axis, enhances SERCA activity via the CAMKII-phospholamban pathway, and reduces the expression of stress markers. These findings suggest that STX12 plays an important role in the energy metabolism and metal homeostasis of cardiomyocytes. Enhancing mitochondrial function, autophagy, and SERCA activity through the administration of rapamycin may provide a potential therapeutic approach for cardiomyopathies associated with STX12 deficiency and hypometabolism.

Keywords: SERCA; Syntaxin 12/13; heart failure; mitochondria; rapamycin.


Conflict of interest statement

The authors declare no conflict of interest.

Figures
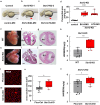
Figure 1
Figure 1
STX12 deficiency‐induced cardiac morphological changes in zebrafish and mice. a–c) Knockdown of Stx12 in zebrafish led to pericardial edema. The phenotypes of zebrafish were represented at 2 dpf after injection of morpholinos into zebrafish eggs to knock down STX12 expression. Scale bar, 100 µm. d) Quantification of pericardial area. The pericardial area of zebrafish significantly increased after Stx12 knockdown (control‐MO, n = 10, E414‐MO, n = 10, t‐test, p < 0.0001; ATG‐MO, n = 10, < 0.0001). e,h) Cardiac stereomicroscopic images of P0 Stx12‐KO (e) and wild‐type littermates (h). Stx12‐KO heart exhibited cardiac malformation. Scale bar, 500 µm. f,g,i,j) Hematoxylin and eosin (HE) staining of coronal section (f, i) and cross section (g, j). Scale bars, 500 µm. k) Scatterplots with boxplots showed that heart weight‐to‐body weight ratio was significantly increased in Stx12‐KO mice (WT, n = 9, KO, n = 11, = 0.0003). l,m) WGA staining of Stx12 myocardial‐specific knockout mice and Stx12‐flox control mice. Scale bar, 10 µm. n) Quantitative analysis of WGA staining (Flox‐control, n = 9, cKO, n = 9; = 0.0272). o) Scatterplots with boxplots showed that the heart weight‐to‐body weight ratio was significantly increased in myocardial‐specific Stx12 knockout mice compared to Stx12‐flox control mice (Flox‐control, n = 10, cKO, n = 10, = 0.0372). Statistical results: *p < 0.05, ***p < 0.001, ****p < 0.0001; t‐test.
Figure 2
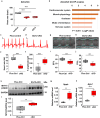
Figure 2
STX12 deficiency caused heart failure in zebrafish and mice. a) Quantification of the heart rates of zebrafish embryos. Heart rate was significantly decreased after Stx12 knockdown (KD) in zebrafish (control, n = 10, KD‐1, n = 10, t‐test, p < 0.0001; KD‐2, n = 10, p < 0.0001). bpm, beats per minute. b) GO‐HP analysis of zebrafish RNAseq data suggested abnormalities of the cardiovascular system after Stx12 knockdown. c,d) Electrocardiograms (ECG) of control (Stx12‐flox) (c) and cardiac‐specific Stx12 knockout mice (d). Scale bars: horizontal 20 ms, vertical 100 µV. e) Quantification of heart rate derived from ECG. Heart rate in Stx12 knockout mice was significantly decreased compared to wild type (Flox‐control, n = 5, CKO, n = 6, < 0.0001). f) Comparison of T wave amplitude. T wave amplitude was significantly increased in Stx12‐cKO (Stx12flox/flox with CTnT‐Cre) mouse electrocardiograms compared to control (Stx12flox/flox ) (Flox‐control, n = 6, cKO, n = 6, <  0.0001). g,h) Representative M‐mode echocardiography of left ventricular chamber in control (Stx12‐flox) (g) and Stx12 cardiac‐specific knockout mice (h). i,j) Measurement of ejection fraction (EF%) (i) and fractional shortening (FS%) (j) of Stx12 cKO mice and control wild‐type mice. Left ventricular EF% in Stx12‐CKO mice was significantly decreased (Flox‐control, n = 9, cKO, n =  8, = 0.0006). Left ventricular FS% in Stx12‐CKO mice significantly decreased (Flox‐control, n = 9, cKO, n = 8, = 0.0004), indicating a decrease in ventricular contractile function. k) Western blot analysis of endogenous MYH7/β‐MHC level in control (Stx12‐flox) and Stx12‐cKO mice hearts. GAPDH was used as a loading control. l) Quantification of Western blot in (k). Myh7 level was significantly decreased compared with the wild type (Flox‐control, n = 7, cKO, n = 5, = 0.0015). m,n) qRT‐PCR analysis of cardiac Nppb (m) and Myh7 (n) mRNA levels in control (Stx12‐flox) and Stx12‐cKO mice heart (n = 6 mice per group). There were significant increases of the mRNA level of Nppb and Myh7 in Stx12‐cKO mice (Nppb: Flox‐control, n = 6, cKO, n = 6, = 0.0011; Myh7: Flox‐control, n = 6, cKO, n = 6, < 0.0001), indicating myocardial hypertrophy and heart failure. Statistical results: **p < 0.01, ***p < 0.001, ****p < 0.0001; t‐test.
Figure 3
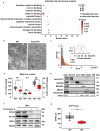
Figure 3
Abnormal mitochondrial morphology, ion imbalance, and energy deficiency in Stx12 KO mouse. a) Zebrafish RNAseq GO enrichment analysis demonstrated the association of Stx12 with iron binding, mitochondrial complex assembly, and vesicle fusion. b) Transmitting electron microscope images of heart sections in E18.5 wild type and Stx12‐KO mice. Representative EM image of heart section in Stx12‐KO (right), and wild type (WT) section (left). The scale bars represent 1 µm. c) Mitochondrial area and cristae density distribution of cardiac mitochondria. Mitochondria derived from Stx12‐KO (361 mitochondria from 3 KO) mice exhibited a significantly larger mitochondrial area than wild type (232 mitochondria from 2 WT). Inset showed that the cardiac mitochondria of Stx12‐KO (n = 57) had significantly decreased cristae density than the mitochondria of wild‐type (n = 57). Red dashed lines represented the averages (in mean ± SD) of Stx12‐KO mitochondrial area (0.61 ± 0.68 µm2) or cristae density (20 ± 3 µm−1), while gray dashed lines represented the mean of wild‐type mitochondrial area (0.28 ± 0.15 µm2, t‐test, p = 1.3 × 10−17) or cristae density (27 ± 3 µm−1, p = 1.7 × 10−22). d) Metal ion content in the heart tissues of Stx12‐KO and wild‐type littermate mice. Scatterplots with boxplots showed that the iron and zinc quantity in the hearts of Stx12‐KO pups significantly decreased compared to wild types (WT) (Fe: WT, n = 12, 255.97 ± 66.44 ug g−1, KO, n = 11, 178.91 ± 52.02 µg g−1, p = 0.0017; Zn: WT, n = 12, 14.72 ± 1.98 ug g−1,KO, n = 11, 10.89 ± 3.07 µg g−1, p = 0.0017), while the copper quantity remained unchanged (Cu: WT, n = 12, 3.95 ± 0.66 ug g−1, KO, n = 12, 3.95 ± 0.66 µg g−1, p = 0.2456). e) Western blot analysis revealed STX12 broad distribution in mitochondria, Golgi, and ER in cardiac tissue. f) STX12 is located in the outer membrane of mitochondria. Mitochondria extracted from cardiac tissue were treated with proteinase K, which digested surface proteins of mitochondria. Tom20, OPA1, and Hsp60 are located on the outer membrane, inner membrane, and matrix of mitochondria, respectively. After protein K treatment, OPA1 and Hsp60 expression remained unchanged, while Tom20 and STX12 expression decreased, indicating that STX12 was located on the outer membrane of mitochondria. g) ATP assay of P0 mouse homogenized heart tissue. ATP assay of homogenized mouse heart tissue. Stx12 knock‐out cardiomyocyte exhibited a significantly decreased ATP level compared with normal mice. (WT, n = 7 mice; KO, n = 5 mice; p = 0.001183). Statistical results: **p < 0.01, ns, not significance; t‐test.
Figure 4
Figure 4
Abnormal electrophysiology of STX12 deficient cardiomyocytes. a) Patch‐clamp recordings of cardiomyocytes were primarily cultured from wild‐type (gray) and Stx12‐KO (red) mice. b) Normalized average action potential curves of wild‐type and Stx12‐KO mouse cardiomyocytes. The repolarization period was fitted with a single exponential decay curve (dashed line) (WT, black, 1361 action potentials of 9 cells; KO, red, 456 action potentials of 8 cells), and the decay constant (τ) was obtained from the fitted results. c) Comparison of the τ of the action potential curves (WT, black, n = 10 cells; KO, red, n = 8 cells, t‐test, p = 0.0272). d,e) Calcium imaging of wild‐type (d) and Stx12‐KO (e) mouse cardiomyocytes cultured in vitro. Images were represented as pseudo‐color, scale bars, 5 µm. The time interval between two images was 0.18 s. f) Calcium dynamics of wild‐type and Stx12‐KO mouse cardiomyocytes cultured in vitro. g) Representative calcium kymograph of single Ca2+ spike of wild‐type cardiomyocyte (upper) and Stx12‐KO (lower) cardiomyocyte. Images were represented as pseudo‐color. h) Calcium dynamical curve of single Ca2+ spike in (g). Compared to wild type, the peak value of stx12‐KO calcium concentration decreased while the decay phase time was prolonged. Statistical results: *p < 0.05; t‐test.
Figure 5
Figure 5
SERCA activity in STX12‐deficient cardiomyocytes and its role in calcium dynamics. a) Zebrafish RNAseq GO enrichment analysis revealed the association of STX12 with cardiac functions. b) Volcano plot of zebrafish RNAseq data. The genes that were significantly changed (p < 0.05) are marked with light red dots, while the rest were marked with gray dots. Stx12 and the ortholog of SERCA2 in zebrafish were marked with green and dark red dots, respectively. c) Western blot analysis of SERCA2 expression in control (Stx12flox/flox ) and Stx12‐cKO (Stx12flox/flox with CTnT‐Cre) mice. d) Quantification of Western blot in (c). SERCA2 level was significantly decreased in Stx12‐cKO compared with control (Stx12‐flox) (Flox‐control, n = 4, cKO, n = 4, = 0.0019). e) The normalized action potential curves of cardiomyocytes in vitro before and after adding thapsigargin (TG), with the arrow indicating the shift of the curve over time. f) The calcium dynamical curves with the arrow indicate the shift of the curve over time (0, 10, 20 min). g) The change in the decaying tau of Ca2+ in cardiomyocytes before and after adding TG (10 min). Tau was significantly increased after adding TG (control, n = 157 curves; TG, n = 72 curves, t‐test, p < 0.0001). h) The Ca2+ change curves under different SR Ca2+ pumps (SERCA) activities were obtained through model simulation. i) Curve of tau constants of Ca2+ during the decay phase of Ca2+ curves obtained through single exponential fitting under different SERCA Ca2+ pump activities. Statistical results: **p < 0.01, ****p < 0.0001; t‐test.
Figure 6
Figure 6
Rapamycin alleviated abnormal electrophysiology in Stx12‐cKO or energy‐deficient cardiomyocytes. a) Kymograph of Ca2+ dynamics in cultured control (Stx12flox/flox ) cardiomyocytes, Stx12‐cKO (Stx12flox/flox with CTnT‐Cre) cardiomyocytes and Stx12‐cKO cardiomyocytes with rapamycin treatment. Time scale bars, 0.5 s. b) Calcium dynamical curves of control and Stx12‐cKO mouse cardiomyocytes cultured in vitro, before and after rapamycin administration. c) Decay constant of Ca2+ in Stx12‐CKO cardiomyocytes before and after rapamycin treatment. The decay constant of Ca2+ dynamics significantly decreased after rapamycin treatment (Flox‐control, n = 55 curves; CKO, n = 19 curves; cKO, rapamycin, n = 23 curves; p < 0.0001). d) Calcium dynamical curves of wild‐type cardiomyocytes in vitro with or without TMRE or rapamycin treatment (WT: black, TMRE: red, TMRE + rapamycin: green). e) Comparison of Ca2+ amplitudes in cardiomyocytes after TMRE and rapamycin treatment. The calcium amplitude was significantly reduced after TMRE treatment, and increased after rapamycin treatment (WT, n = 20; TMRE, n = 19, < 0.0001; TMRE + rapamycin, n = 6, p < 0.0001). f) The decaying constant τ of Ca2+ in cardiomyocytes with or without TMRE or rapamycin treatment. Tau was significantly increased after TMRE treatment, and decreased after rapamycin treatment (WT, n = 16; TMRE, n = 10, p < 0.0001; TMRE + rapamycin, n = 7, = 0.004). Statistical results: **p < 0.01, ****p < 0.0001; t‐test.
Figure 7
Figure 7
Rapamycin treatment relieved cardiac failure in Stx12‐cKO mice. a) Schematic diagram of rapamycin injection in mice. Cardiac functions were evaluated by echocardiography after intraperitoneally daily injection in Stx12‐cKO (Stx12flox/flox with CTnT‐Cre) and control (Stx12flox/flox ) mice for one week. b) Representative M‐mode echocardiography of left ventricular chamber of control (Stx12‐flox) and Stx12‐cKO mice after rapamycin or vehicle treatment. c,d) Changes in ejection fraction (EF%) (c) and fractional shortening (FS%) (d) of the left ventricle in control (Stx12‐flox) and Stx12‐cKO mice after rapamycin or vehicle treatment. EF% was significantly increased in Stx12‐cKO mice after rapamycin treatment (Flox‐control + vehicle, n = 8; Flox‐control + rapamycin, n = 8; cKO + vehicle, n = 7, t‐test, p = 0.0003; cKO + rapamycin, n = 9, = 0.0025). FS% was significantly increased in Stx12‐cKO mice after rapamycin treatment (Flox‐control + vehicle, n = 8; Flox‐control + rapamycin, n = 8; cKO + vehicle, n = 7, p = 0.0003; cKO + rapamycin, n = 9, = 0.0025). e) Western blot analysis of S6K, phosphorylated S6K, and MYH7 in control (Stx12‐flox) and Stx12‐cKO mice, with GAPDH as the loading control. f) Quantification of Western blot of phosphorylated S6K (Flox‐control + vehicle, n = 6; Flox‐control + rapamycin, n = 6; cKO + vehicle, n = 6; cKO + rapamycin, n = 6; Flox‐control + vehicle vs cKO + vehicle, = 0.00373; cKO + vehicle vs cKO + rapamycin, = 0.0020). g) Quantification of Western blot of MYH7 (Flox‐control + vehicle, n = 6; Flox‐control + rapamycin, n = 6; cKO + vehicle, n = 6; cKO + rapamycin, n = 6; Flox‐control + vehicle vs cKO + vehicle, = 0.0037; cKO + vehicle vs cKO + rapamycin, = 0.0057). Statistical results: **p < 0.01, ***p < 0.001, ****p < 0.0001; t‐test.
Figure 8
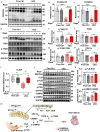
Figure 8
Rapamycin treatment enhanced mitochondrial protein synthesis and SERCA2 activity. a) Changes in the expressions of oxidative phosphorylation complexes (OXPHOS) in control (Stx12‐flox) and Stx12‐cKO mice after rapamycin or vehicle intervention, with GAPDH as the loading control. b) Quantification of Western blot of complex IV (Flox‐control + vehicle, n = 9; Flox‐control + rapamycin, n = 9; cKO + vehicle, n = 9; cKO + rapamycin, n = 9; Flox‐control + vehicle and cKO + vehicle, p < 0.0001; cKO + vehicle and cKO + rapamycin, p < 0.0001). c) Quantification of Western blot of complex I (Flox‐control + vehicle, n = 9; Flox‐control + rapamycin, n = 9; cKO + vehicle, n = 9; cKO + rapamycin, n = 9; Flox‐control + vehicle and cKO + vehicle, p < 0.0001; cKO + vehicle and cKO + rapamycin, p < 0.0001). d) Changes in the expressions of LC3b, TFEB, and its phosphorylated form as well as PGC1α in control (Stx12‐flox) and Stx12‐cKO mice after rapamycin or vehicle intervention, with GAPDH as the loading control. e) Quantification of Western blot of LC3II to LC3I ratio (Flox‐control + vehicle, n = 6; Flox‐control + rapamycin, n = 6; cKO + vehicle, n = 6; cKO + rapamycin, n = 6; Flox‐control + vehicle and Flox‐control + rapamycin, p = 0.0116; cKO + vehicle and cKO + rapamycin, p = 0.0068). f) Quantification of Western blot of TFEB (Flox‐control + vehicle, n = 6; Flox‐control + rapamycin, n = 6; cKO + vehicle, n = 6; cKO + rapamycin, n = 6; Flox‐control + vehicle and cKO + vehicle, = 0.0463; cKO + vehicle and cKO + rapamycin, p = 0.0149). g) Quantification of Western blot of phosphorylated TFEB (Flox‐control + vehicle, n = 6; Flox‐control + rapamycin, n = 6; cKO + vehicle, n = 6; cKO + rapamycin, n = 6; cKO + vehicle and cKO + rapamycin, p = 0.0092). h) Quantification of Western blot of PGC1α (Flox‐control + vehicle, n = 6; Flox‐control + rapamycin, n = 6; cKO + vehicle, n = 6; cKO + rapamycin, n = 6; Flox‐control + vehicle and cKO + vehicle, p = 0.0001; cKO + vehicle and cKO + rapamycin, p = 0.0044). i) ELISA analysis of SERCA level in Stx12‐CKO (Stx12flox/flox with CTnT‐Cre) and control (Stx12flox/flox ) mice after rapamycin or vehicle injection (Flox‐control + vehicle, n = 6; control + rapamycin, n = 6; cKO + vehicle, n = 6; cKO + rapamycin, n = 6; Flox‐control + vehicle and cKO + vehicle, p = 0.0012; cKO + vehicle and cKO + rapamycin, p = 0.0048). j) Western blot analysis of sarcoplasmic reticulum Ca2+ ATPase SERCA2, phospholamban (PLB) and its phosphorylated form, PKA and its phosphorylated form, as well as CAMKII and its phosphorylated form in control (Stx12‐flox) and Stx12‐cKO mice after rapamycin or vehicle intervention, with GAPDH as the loading control. k) Quantification of Western blot of phosphorylated phospholamban (Flox‐control + vehicle, n = 6; Flox‐control + rapamycin, n = 6; cKO + vehicle, n = 6; cKO + rapamycin, n = 6; Flox‐control + vehicle and cKO + vehicle, p = 0.0011; cKO + vehicle and cKO + rapamycin, p = 0.0019). l) Quantification of Western blot of phosphorylated CAMKII (Flox‐control + vehicle, n = 6; Flox‐control + rapamycin, n = 6; cKO + vehicle, n = 6; cKO + rapamycin, n = 6; Flox‐control + vehicle and Flox‐control + rapamycin, p = 0.0020; cKO + vehicle and cKO + rapamycin, p = 0.0042). m) A schematic shows that STX12 is involved in iron transportation and respiration complex assembly. Rapamycin treatment can enhance both mitochondrial protein biosynthesis and SERCA2 activity, ultimately contributing to the amelioration of heart failure in Stx12‐cKO mice. Statistical results: *p < 0.05, **p < 0.01, ***p < 0.001, ****p < 0.0001; t‐test.

References

    1. King M., Kingery J., Casey B., Am. Fam. Physician 2012, 85, 1161. - PubMed
    1. Kemp C. D., Conte J. V., Cardiovasc. Pathol. 2012, 21, 365. - PubMed
    1. Tham Y. K., Bernardo B. C., Ooi J. Y. Y., Weeks K. L., McMullen J. R., Arch. Toxicol. 2015, 89, 1401. - PubMed
    1. Ruwhof C., van der Laarse A., Cardiovasc. Res. 2000, 47, 23. - PubMed
    1. Nakamura M., Sadoshima J., Nat. Rev. Cardiol. 2018, 15, 387. - PubMed

MeSH terms

Substances

LinkOut - more resources