

Analysis of natural structures and chemical mapping data reveals local stability compensation in RNA
- PMID: 40568944
- PMCID: PMC12199142
- DOI: 10.1093/nar/gkaf565
Analysis of natural structures and chemical mapping data reveals local stability compensation in RNA
Abstract
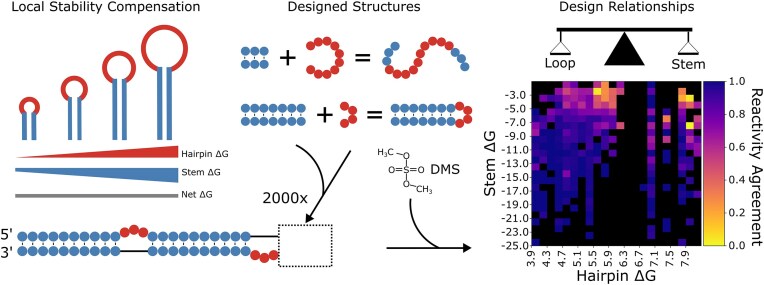
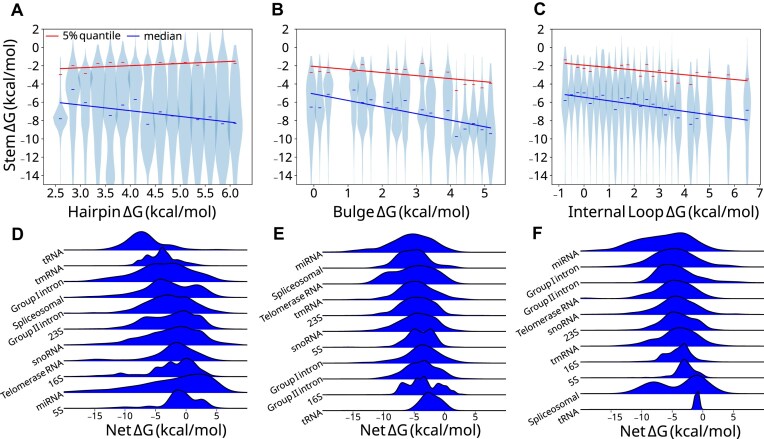
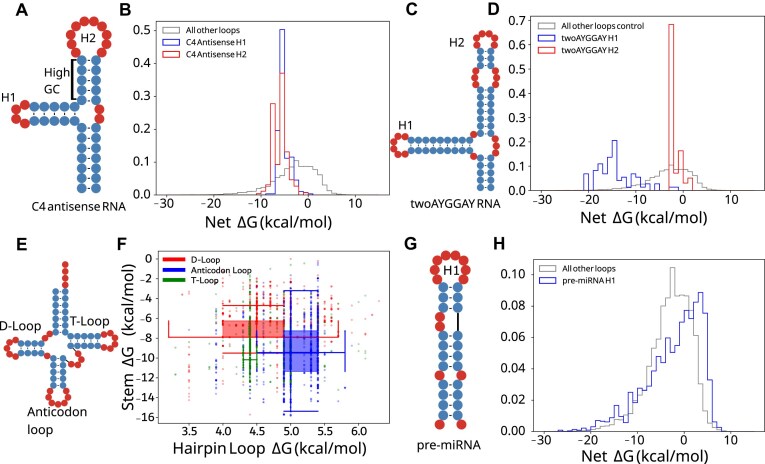
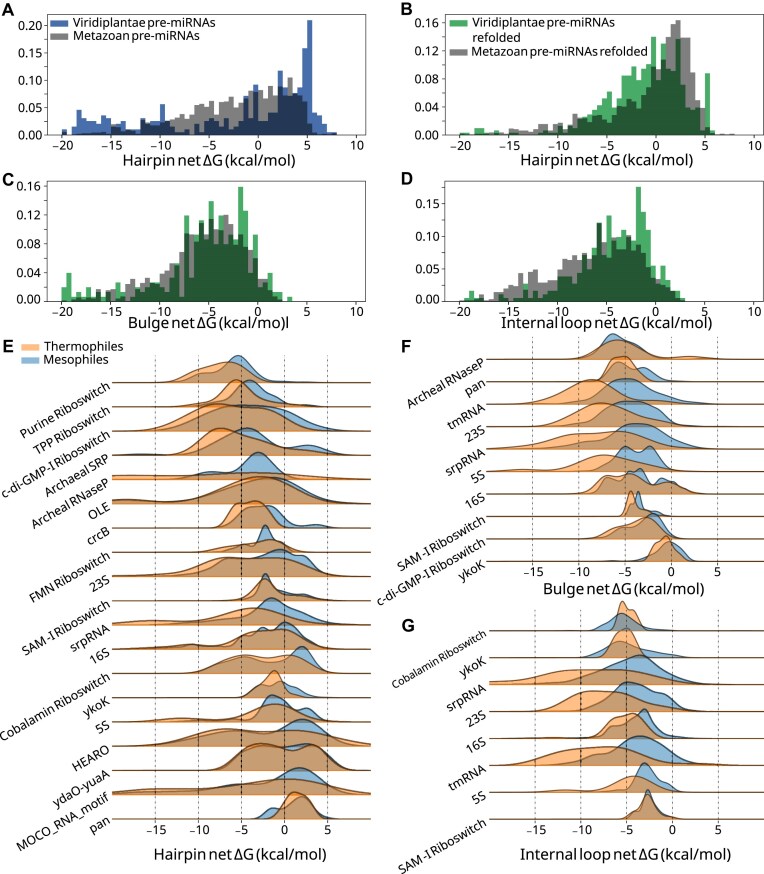
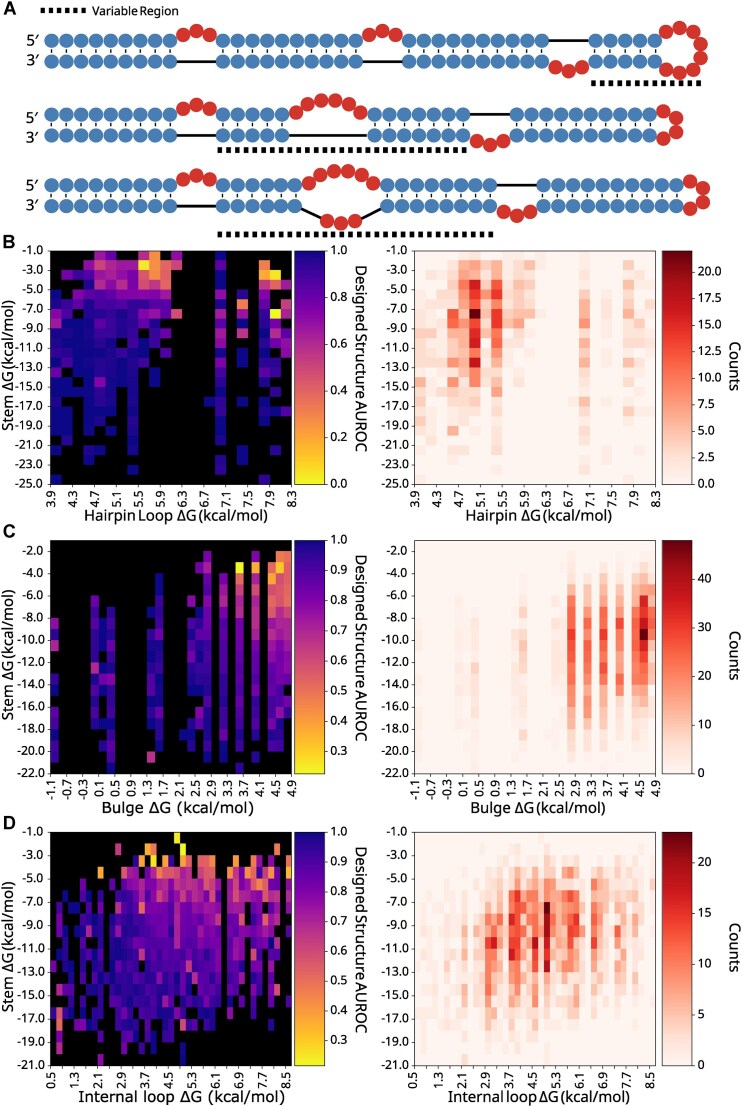
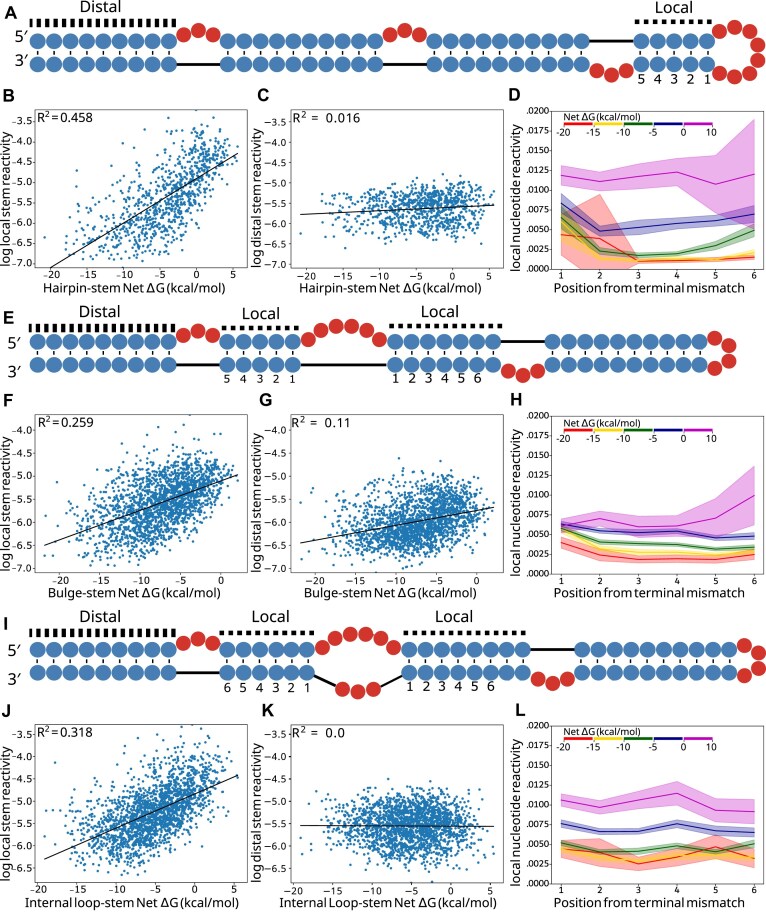
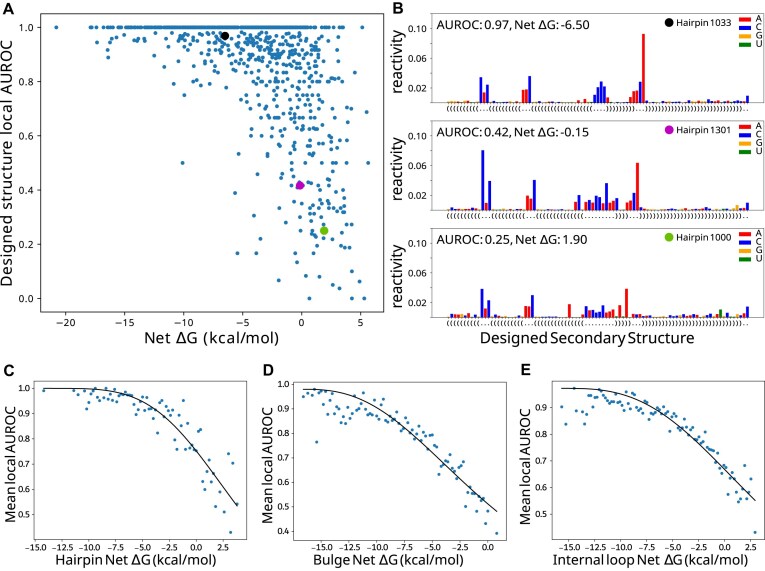
RNA molecules adopt complex structures that perform essential biological functions across all forms of life, making them promising candidates for therapeutic applications. However, our ability to design new RNA structures remains limited by an incomplete understanding of their folding principles. While global metrics such as the minimum free energy are widely used, they are at odds with naturally occurring structures and incompatible with established design rules. Here, we introduce local stability compensation (LSC), a principle that RNA folding is governed by the local balance between destabilizing loops and their stabilizing adjacent stems, challenging the focus on global energetic optimization. Analysis of over 100 000 RNA structures revealed that LSC signatures are particularly pronounced in bulges and their adjacent stems, with distinct patterns across different RNA families that align with their biological functions. To validate LSC experimentally, we systematically analyzed thousands of RNA variants using DMS chemical mapping. Our results demonstrate that stem folding, as measured by reactivity, correlates with LSC (R² = 0.458 for hairpin loops) and that instabilities show no significant effect on folding for distal stems. These findings demonstrate that LSC can be a guiding principle for understanding RNA function and for the rational design of custom RNAs.
© The Author(s) 2025. Published by Oxford University Press on behalf of Nucleic Acids Research.
Conflict of interest statement
None declared.
Figures
Update of
-
Analysis of natural structures and chemical mapping data reveals local stability compensation in RNA.bioRxiv [Preprint]. 2025 Apr 11:2024.12.11.627843. doi: 10.1101/2024.12.11.627843. bioRxiv. 2025. Update in: Nucleic Acids Res. 2025 Jun 20;53(12):gkaf565. doi: 10.1093/nar/gkaf565. PMID: 39713387 Free PMC article. Updated. Preprint.
Similar articles
-
Analysis of natural structures and chemical mapping data reveals local stability compensation in RNA.bioRxiv [Preprint]. 2025 Apr 11:2024.12.11.627843. doi: 10.1101/2024.12.11.627843. bioRxiv. 2025. Update in: Nucleic Acids Res. 2025 Jun 20;53(12):gkaf565. doi: 10.1093/nar/gkaf565. PMID: 39713387 Free PMC article. Updated. Preprint.
-
Home treatment for mental health problems: a systematic review.Health Technol Assess. 2001;5(15):1-139. doi: 10.3310/hta5150. Health Technol Assess. 2001. PMID: 11532236
-
Signs and symptoms to determine if a patient presenting in primary care or hospital outpatient settings has COVID-19.Cochrane Database Syst Rev. 2022 May 20;5(5):CD013665. doi: 10.1002/14651858.CD013665.pub3. Cochrane Database Syst Rev. 2022. PMID: 35593186 Free PMC article.
-
Systemic pharmacological treatments for chronic plaque psoriasis: a network meta-analysis.Cochrane Database Syst Rev. 2021 Apr 19;4(4):CD011535. doi: 10.1002/14651858.CD011535.pub4. Cochrane Database Syst Rev. 2021. Update in: Cochrane Database Syst Rev. 2022 May 23;5:CD011535. doi: 10.1002/14651858.CD011535.pub5. PMID: 33871055 Free PMC article. Updated.
-
Systemic pharmacological treatments for chronic plaque psoriasis: a network meta-analysis.Cochrane Database Syst Rev. 2017 Dec 22;12(12):CD011535. doi: 10.1002/14651858.CD011535.pub2. Cochrane Database Syst Rev. 2017. Update in: Cochrane Database Syst Rev. 2020 Jan 9;1:CD011535. doi: 10.1002/14651858.CD011535.pub3. PMID: 29271481 Free PMC article. Updated.
References
MeSH terms
Substances
Grants and funding
LinkOut - more resources
Full Text Sources
