

An Investigation of TDA1 Deficiency in Saccharomyces cerevisiae During Diauxic Growth
- PMID: 40568959
- PMCID: PMC12232523
- DOI: 10.1002/yea.4004
An Investigation of TDA1 Deficiency in Saccharomyces cerevisiae During Diauxic Growth
Abstract
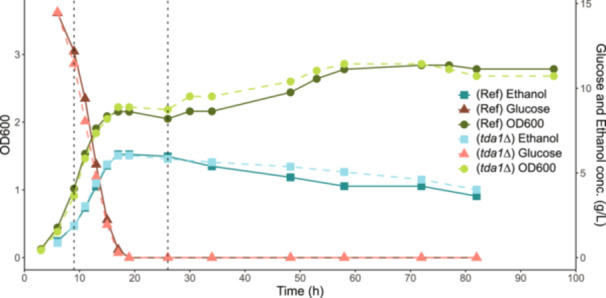
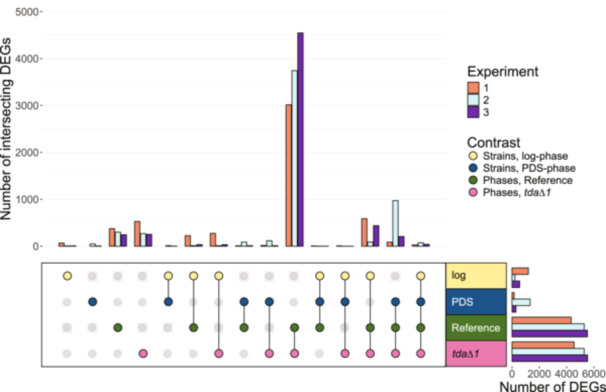
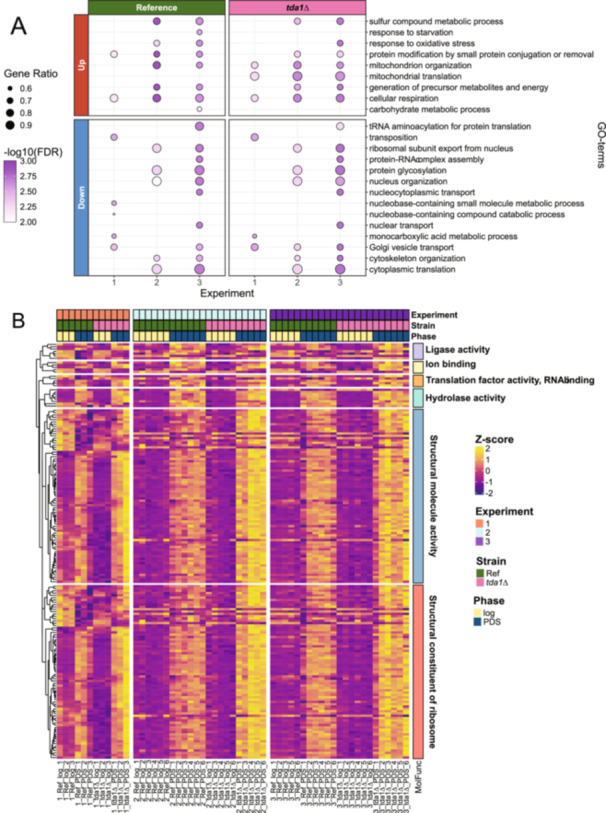
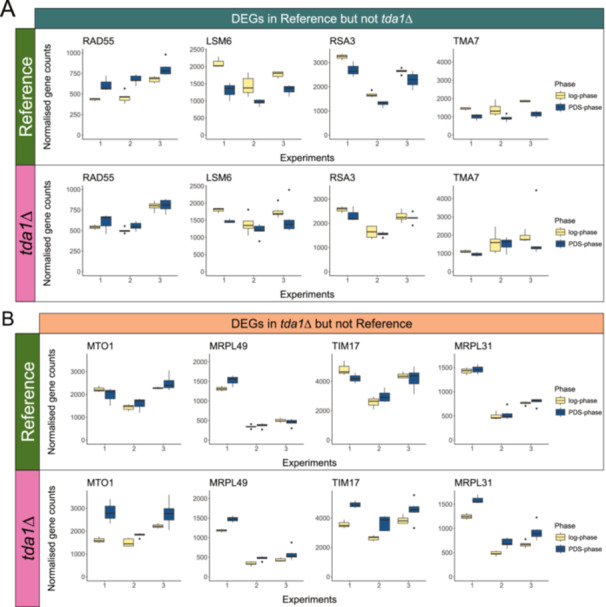
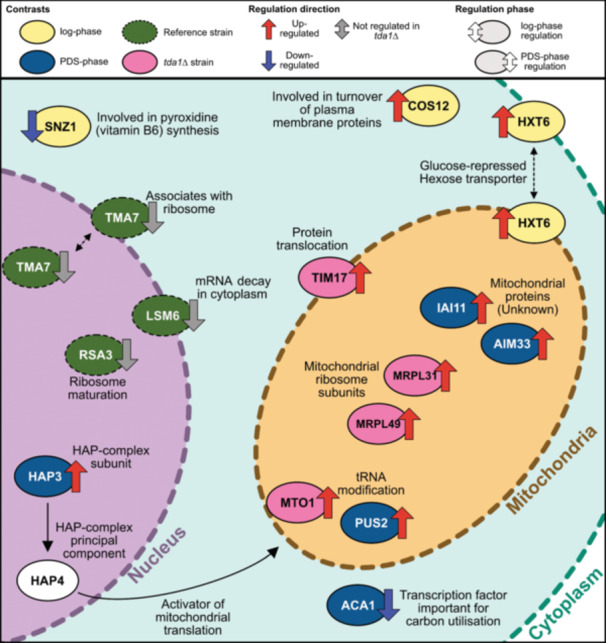
Tda1p is a protein kinase in Saccharomyces cerevisiae. Here we investigate the function of TDA1 during the diauxic shift using transcriptomics. We compared the gene expression in the deletion mutant tda1∆ and the reference strain (BY4741) during both the aerobic fermentation phase (log phase), and the respiratory phase (post-diauxic shift phase, PDS) in three separate independent experiments. We found: Differential gene expression analysis showed that compared to the reference strain, the tda1∆ mutant exhibited an upregulation of the glucose repressed hexose transporter HXT6 during the log phase, and upregulation of mitochondrial proteins and genes related to mitochondrial translation during the PDS phase. Gene set enrichment analysis showed an enrichment in mitochondrial translation in the PDS phase for the deletion mutant tda1∆, but not for the reference strain. Transcription factor analysis showed that the enrichment of Mig1p repressed genes was not statistically significant in TDA1 deletion mutants for neither log-phase nor PDS-phase. This conflicted with the previously suggested model that argued for an interaction between Tda1p and Mig1p. Instead, transcription factor analysis showed an enrichment of genes regulated by the HAP-complex, which regulates mitochondrial translation, during the PDS-phase in the tda1∆ mutant. The combined evidence from this study indicates that Tda1p does not participate in Mig1p-mediated glucose repression. Instead, we propose that it is involved in the regulation of mitochondrial translation by repressing the expression of HAP complex subunits.
Keywords: TDA1; diauxic growth; differential gene expression; glucose repression; mitochondrial translation; transcriptomics.
© 2025 The Author(s). Yeast published by John Wiley & Sons Ltd.
Conflict of interest statement
The authors declare no conflicts of interest.
Figures
Similar articles
-
Valproate independently activates Snf1, inhibits TORC1, and induces repression of INO1 transcription by increasing nuclear localization of Opi1.Sci Rep. 2025 Jul 9;15(1):24601. doi: 10.1038/s41598-025-07540-2. Sci Rep. 2025. PMID: 40634329 Free PMC article.
-
The yeast checkpoint kinase Dun1p represses transcription of RNR genes independently of catalytic activity or Rad53p during respiratory growth.J Biol Chem. 2025 Mar;301(3):108232. doi: 10.1016/j.jbc.2025.108232. Epub 2025 Jan 27. J Biol Chem. 2025. PMID: 39880091 Free PMC article.
-
Impact of residual disease as a prognostic factor for survival in women with advanced epithelial ovarian cancer after primary surgery.Cochrane Database Syst Rev. 2022 Sep 26;9(9):CD015048. doi: 10.1002/14651858.CD015048.pub2. Cochrane Database Syst Rev. 2022. PMID: 36161421 Free PMC article.
-
Comparison of Two Modern Survival Prediction Tools, SORG-MLA and METSSS, in Patients With Symptomatic Long-bone Metastases Who Underwent Local Treatment With Surgery Followed by Radiotherapy and With Radiotherapy Alone.Clin Orthop Relat Res. 2024 Dec 1;482(12):2193-2208. doi: 10.1097/CORR.0000000000003185. Epub 2024 Jul 23. Clin Orthop Relat Res. 2024. PMID: 39051924
-
Antibody tests for identification of current and past infection with SARS-CoV-2.Cochrane Database Syst Rev. 2022 Nov 17;11(11):CD013652. doi: 10.1002/14651858.CD013652.pub2. Cochrane Database Syst Rev. 2022. PMID: 36394900 Free PMC article.
References
-
- Di Bartolomeo, F. , Malina C., Campbell K., et al. 2020. “Absolute Yeast Mitochondrial Proteome Quantification Reveals Trade‐off Between Biosynthesis and Energy Generation During Diauxic Shift.” Proceedings of the National Academy of Sciences 117, no. 13: 7524–7535. 10.1073/pnas.1918216117. - DOI - PMC - PubMed
-
- Boschloo, R. D. 1970. “Raised Conditional Level of Significance for the 2 × 2‐Table When Testing the Equality of two Probabilities.” Statistica Neerlandica 24, no. 1: 1–9. 10.1111/j.1467-9574.1970.tb00104.x. - DOI
Publication types
MeSH terms
Substances
LinkOut - more resources
Full Text Sources
Miscellaneous