. 2025 Jan 2;19(1):wraf131.
doi: 10.1093/ismejo/wraf131.

Microbial cross-feeding stabilized by segregation of a dependent mutant from its independent ancestor

Affiliations

Microbial cross-feeding stabilized by segregation of a dependent mutant from its independent ancestor

Olivia F Schakel et al. ISME J. .

Abstract

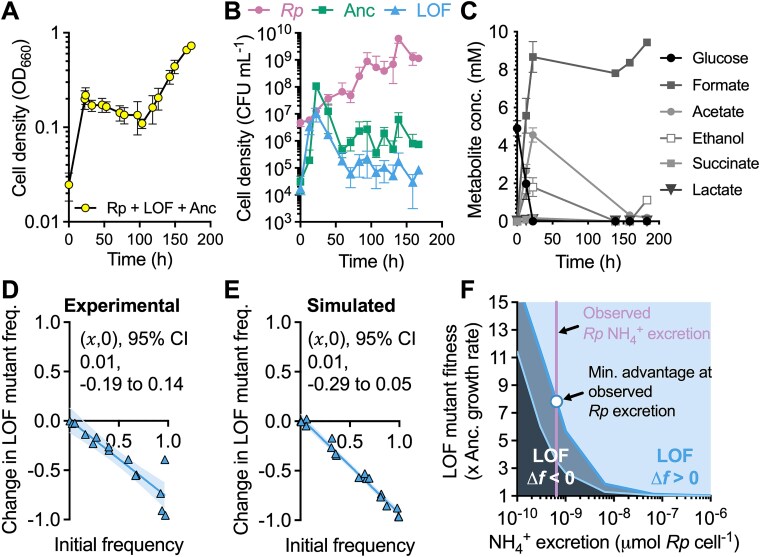
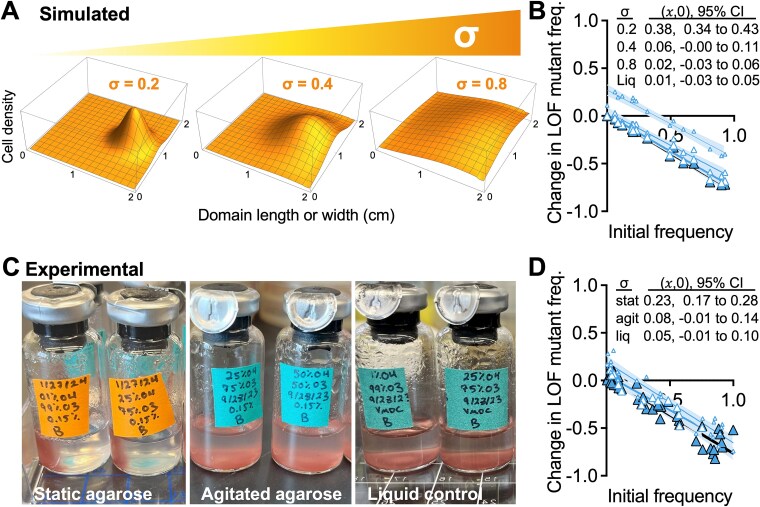
Microbial gene loss is hypothesized to be beneficial when gene function is costly, and the gene product can be replaced via cross-feeding from a neighbor. However, cross-fed metabolites are often only available at low concentrations, limiting the growth rates of gene-loss mutants that are dependent on those metabolites. Here we define conditions that support a loss of function mutant in a three-member bacterial community of (i) N2-utilizing Rhodopseudomonas palustris as an NH4+-excreting producer, (ii) N2-utilizing Vibrio natriegens as the ancestor, and (iii) a V. natriegens N2-utilizaton mutant that is dependent on the producer for NH4+. Using experimental and simulated cocultures, we found that the ancestor outcompeted the mutant due to low NH4+ availability under uniform conditions where both V. natriegens strains had equal access to nutrients. However, spatial structuring that increasingly segregated the mutant from the ancestor, while maintaining access to NH4+ from the producer, allowed the mutant to avoid extinction. Counter to predictions, mutant enrichment under spatially structured conditions did not require a growth rate advantage from gene loss and the mutant coexisted with its ancestor. Thus, cross-feeding can originate from loss-of-function mutations that are otherwise detrimental, provided that the mutant can segregate from a competitive ancestor.

Keywords: Rhodopseudomonas palustris; Vibrio natriegens; Black Queen Hypothesis; cross-feeding; excretion; gene loss; microbial interactions; microbial physiology; mutualism; syntrophy.


Conflict of interest statement

None declared.

Figures

Graphical Abstract
Graphical Abstract
Figure 1
Figure 1
The LOF mutant growth rate is inferior to that of the ancestor due to the low concentration of cross-fed nutrient; (A) the coculture consists of (i) a producer, R. palustris (Rp) that fixes N2 and excretes NH4+ due to a NifA* mutation, and two V. natriegens (Vn) strains consisting of, (ii) a recipient that is incapable of N2 fixation and depends on the producer for NH4+, and (iii) a self-sufficient, N2-fixing ancestor; all strains are non-motile; (B) Monod model estimates of V. natriegens ancestor and mutant growth rates in the coculture based on the concentration of each nitrogen source (symbols); despite a higher maximum growth rate possible with NH4+, sub-saturating NH4+ concentrations dictate that the ancestor will grow faster with N2 (square) than the mutant with NH4+ (triangle); see the Methods for model details; (C) estimated ancestor and recipient growth rates in coculture with each nitrogen source.
Figure 2
Figure 2
The ancestor outcompetes the LOF mutant in shaken cocultures; (A) growth of shaken cocultures of R. palustris, V. natriegens ΔnifA LOF mutant, and WT V. natriegens “ancestor;” (B) growth of each strain, determined using selective plating for CFUs; (C) glucose and fermentation product concentrations in cocultures; (A-C) points are means ± SD (n = 3); (D, E) IFR assays in shaken liquid experimental cocultures (D) or simulated cocultures with spatially uniform conditions (E); coexistence is assumed if the 𝑥-intercept (𝑥,0) is between 0 and 1, otherwise it is assumed that one population drives the other to extinction; each point is a single experimental or simulated coculture; initial LOF mutant frequencies were the same for experimental and simulated cocultures (initial frequency range = 0.5%–97.3% using V. natriegens populations only); 𝑥-intercept and 95% CI error bands were determined using linear regression analysis; (F) boundaries where the LOF mutant change in frequency goes from negative (Δf < 0; extinction) to positive (Δf > 0; enriched) for different producer (Rp) NH4+ excretion levels and LOF mutant maximum growth rate (formula image) values relative to the ancestor (Anc); LOF mutant initial frequency f0 = 0.061; outer dark blue boundary line, results with observed producer maximum growth rate; inner light blue boundary line, results if producer maximum growth rate = ancestor maximum growth rate; purple vertical line, experimentally-estimated producer NH4+ excretion level; circle, minimum LOF mutant growth advantage required to avoid extinction at the experimentally-estimated producer NH4+ excretion level.
Figure 3
Figure 3
Hypothetical extracellular NH4+ production allows for enrichment of the LOF mutant in accordance with the BQH; (A) the modified model allows for production of NH4+ via a hypothetical extracellular enzyme (circles) produced by the N2-fixing producer and ancestor populations; (B) simulated IFR with extracellular NH4+ production under spatially uniform conditions; initial LOF mutant frequency range = 0.1%–92.8% using V. natriegens populations only.
Figure 4
Figure 4
Segregation from ancestor populations can theoretically lead to local and domain-level enrichment of the LOF mutant; (A) experimental approaches to randomly distribute non-motile cells in static liquid cocultures without or with a fluid 0.15% agarose matrix; community composition was assessed after 6 days by selective plating; experimental (B) and simulated (C) IFR assays with randomized cell distributions in static liquid or 0.15% agarose; each point is from an individual experimental or simulated coculture; initial LOF mutant frequencies were the same for experimental and simulated cocultures (initial frequency range = 0.1%–99.9% using V. natriegens populations only); experimental IFR assays were only mixed before sampling; 𝑥-intercept and 95% CI error bands were determined using linear regression analysis; simulated agarose used lower diffusion coefficients; (D) simulated cell densities in a 2 formula image 2 cm domain (assumed to be uniform across height) at 0 h and 50 h; initial LOF mutant frequency f0 was 0.061; initial random beneficiary and producer populations were specified using a common filter parameter (p = 0.80); the ancestor population was distributed using p = 0.05; dotted lines show the boundaries of where a competitor population is relatively high (compare top vs bottom graphs); (E) mean LOF mutant change in frequency (formula image) from different random cell distributions (LOF mutant and producer given by p = 0.80 for all ancestor filter parameter values); n = 10 except the enlarged data point, where n = 30; error bands = SD; (F) histogram for the enlarged data point in (E) where the ancestor p = 0.07 (n = 30), and the LOF mutant change in frequency is ~0; this threshold change in frequency value is unique to these simulation parameters.
Figure 5
Figure 5
Colocalization with the producer and segregation from the ancestor leads to domain-level enrichment of the LOF mutant; (A) example of simulated Gaussian distributions of initial populations; the LOF mutant and the producer were colocalized but are shown on separate graphs for visualization purposes; cell densities are assumed to be uniform across height; different producer y-axis scales were used to make the initial population visible; (B) simulated IFR in liquid versus 0.15% agarose using the distinct inoculation sites in (A); (C) experimental cocultures were inoculated to static liquid or to locations in 0.15% agarose; localization is evident from pigmented R. palustris growth after 6 days; (D, E) cell densities (D) and glucose and acetate concentrations (E), inferred from samples taken at the inoculation site and at the opposite side of the vial in ancestor monocultures with 0.15% agarose; points are means ± SD, n = 3; (F) IFR from the experimental conditions; cocultures were only mixed before sampling (B, F) each point is from an individual experimental or simulated coculture; initial LOF mutant frequencies were the same for experimental and simulated cocultures (initial frequency range = 0.1%–92.7% using V. natriegens populations only); 𝑥-intercept and 95% CI error bands were determined using linear regression analysis; final LOF mutant frequency (G, using V. natriegens populations only) and the producer (H, using all populations) in static liquid or 0.15% agarose; bars are means ± SD, n = 15; P value is from a two-tail t-test.
Figure 6
Figure 6
Segregation from the ancestor allows the LOF mutant to be enriched without an intrinsic maximum growth rate (formula image) advantage when colocalized with the producer; all graphs are from simulated cocultures using an initial LOF mutant frequency f0 of 0.061 (V. natriegens populations only); all localized conditions (A-C,E,F) used initial population spatial distributions as in Fig. 5A where the producer and LOF inoculums are colocalized (σ = 0.2); (A) the highest growth rates in the spatial domain; (B, C) a cross-section across the domain at t = 10 h and formula image = 1 cm shows that the highest growth rate does not always occur at the same location as the highest cell density; to compare growth rates, we therefore adopted an effective growth rate (formula image), which is a spatially averaged growth rate weighed by cell density (Supplementary material, Eqs. (22)–(23)); effective growth rates with uniform (D) or localized conditions (E) when the LOF mutant does, and does not have a 10% maximum growth rate advantage (adv) over the ancestor (Anc); (F) change in frequency for the conditions in (E) when the LOF mutant does not have a maximum growth advantage; change in frequency was calculated from time integrals of the effective growth rates (Supplementary material, Eq. (34) and Fig. S9).
Figure 7
Figure 7
Increasing population overlap prevents enrichment of the LOF mutant; (A) initial population distribution varied by σ (standard deviation of Gaussian distributed inoculum); the formula image-scales are arbitrary to demonstrate how increasing σ both flattens and broadens the initial population distribution; (B) simulated IFR assays using different σ for all populations to affect overlap between the ancestor and LOF populations; inoculum locations were the same as in Fig. 5, where the LOF mutant and producer are colocalized; (C) experimental conditions varied σ by not disturbing 0.15% agarose (stat), agitating agarose by stirring before inoculation (agit), or using static liquid (liq); the degree of localized populations is evident from growth of pigmented R. palustris after 6 days; (D) IFR results from (C) cocultures were only mixed before sampling; (B, D) each point is from an individual experimental or simulated coculture; initial LOF mutant frequencies were the same for experimental and simulated cocultures (initial frequency range = 3.1%–91.4% using V. natriegens populations only); 𝑥-intercept and 95% CI error bands were determined using linear regression analysis.
Figure 8
Figure 8
The LOF mutant can be enriched even when segregated from colocalized ancestor and producer populations; (A) initial population distributions (not to scale); (B,C) simulated (B) and experimental (C) IFR assays comparing conditions where either the LOF mutant or the ancestor is colocalized with the producer; each point is from an individual simulated or experimental coculture; initial LOF mutant frequencies were the same for experimental and simulated cocultures (initial frequency range = 0.1%–92.8% using V. natriegens populations only); experimental cocultures were only mixed before sampling; 𝑥-intercept and 95% CI error bands were determined using linear regression analysis; (D) effective growth rates for a simulation where the initial populations are distributed as in (A) with an initial LOF mutant frequency f0 = 0.061.

Similar articles

References

    1. Morris JJ, Lenski RE, Zinser ER. The Black Queen Hypothesis: evolution of dependencies through adaptive gene loss. mBio 2012;3:e00036–12. 10.1128/mBio.00036-12 - DOI - PMC - PubMed
    1. Morris JJ. Black Queen evolution: the role of leakiness in structuring microbial communities. Trends Genet 2015;31:475–82. 10.1016/j.tig.2015.05.004 - DOI - PubMed
    1. Ghoul M, Griffin AS, West SA. Toward an evolutionary definition of cheating. Evolution 2014;68:318–31. 10.1111/evo.12266 - DOI - PubMed
    1. Smith P, Schuster M. Public goods and cheating in microbes. Curr Biol 2019;29:R442–7. 10.1016/j.cub.2019.03.001 - DOI - PubMed
    1. D'Souza G, Shitut S, Preussger D. et al. Ecology and evolution of metabolic cross-feeding interactions in bacteria. Nat Prod Rep 2018;35:455–88. 10.1039/C8NP00009C - DOI - PubMed

Supplementary concepts

LinkOut - more resources