. 2025 Jan 2;19(1):wraf132.
doi: 10.1093/ismejo/wraf132.

Cell type-specific immune regulation under symbiosis in a facultatively symbiotic coral

Affiliations

Cell type-specific immune regulation under symbiosis in a facultatively symbiotic coral

Maria Valadez-Ingersoll et al. ISME J. .

Abstract

Many cnidarians host single-celled algae within gastrodermal cells, yielding a mutually beneficial exchange of nutrients between host and symbiont, and dysbiosis can lead to host mortality. Previous research has uncovered symbiosis tradeoffs, including suppression of immune pathways in hosts, and correlations between symbiotic state and pathogen susceptibility. Here, we used a multiomic approach to characterize symbiotic states of the facultatively symbiotic coral Oculina arbuscula by generating genotype-controlled fragments of symbiotic and aposymbiotic tissue. 16S rRNA gene sequencing showed no difference in bacterial communities between symbiotic states. Whole-organism proteomics revealed differential abundance of proteins related to immunity, confirming immune suppression during symbiosis. Single-cell RNAseq identified diverse cell clusters within seven cell types across symbiotic states. Specifically, the gastrodermal cell clusters containing algal-hosting cells from symbiotic tissue had higher expression of nitrogen cycling and lipid metabolism genes than aposymbiotic gastrodermal cells. Furthermore, differential enrichment of immune system gene pathways and lower expression of genes involved in immune regulation were observed in these gastrodermal cells from symbiotic tissue. However, there were no differences in gene expression in the immune cell cluster between symbiotic states. We conclude that there is evidence for compartmentalization of immune system regulation in specific gastrodermal cells in symbiosis. This compartmentalization may limit symbiosis tradeoffs by dampening immunity in algal-hosting cells while simultaneously maintaining general organismal immunity.

Keywords: coral; immunity; proteomics; single-cell RNA-sequencing; symbiosis.


Conflict of interest statement

None declared.

Figures

Figure 1
Figure 1
Symbiosis facilitates higher light absorptance but does not change bacterial communities in O. arbuscula. (A) Algal cell counts are ~400-fold greater in symbiotic (brown, right) O. arbuscula fragments than in aposymbiotic (white/grey, left) fragments (P value <0.001). (B) Average reflectance (R) in the PAR region (400–700 nm) was 22% +/− 4% in symbiotic O. arbuscula (brown) and 77% +/− 3% in aposymbiotic O. arbuscula (grey) (P < 0.01). (C) Average absorptance (A) (A = 1-R) indicating the relative amount of solar energy with potential for use in photosynthesis. Symbiotic O. arbuscula (brown) has an A675 of 85% (+/− 4%), suggesting a functional symbiosis, and aposymbiotic (grey) has an A675 of 24% (+/− 2%) (P < 0.001). In (B) and (C), shaded colored areas represent standard deviation. (D) PCoA of bacterial communities from all ASVs in 16S rRNA gene data from symbiotic (brown) and aposymbiotic (grey) O. arbuscula genotypes. No differences in bacterial communities were observed between symbiotic states.
Figure 2
Figure 2
Proteomic profiles of symbiotic and aposymbiotic O. arbuscula reveal differential enrichment of proteins by symbiotic state. (A) Principal component analysis of proteomic profiles across four genets, with symbiotic (sym) and aposymbiotic (apo) states distinguished by color, and genets by shape. (B) Volcano plot of differentially enriched proteins (DEPs) identified through pairwise comparison (P < 0.1). Upregulated proteins (134) are represented by brown dots, downregulated proteins (99) by grey dots, and black dots indicate non-DEPs in symbiotic relative to aposymbiotic corals (total N = 2,543). (C) Heatmap of all DEPs across symbiotic states of O. arbuscula. The color scale represents the log2fold change of each protein (row) for each coral sample (column) relative to the protein’s mean expression value across all samples. (D) Interaction network of proteins associated with immune response, repair and stress response, and metabolic processes, derived from human protein-protein interactions in the STRING database. Node colors indicate upregulation (brown) or downregulation (grey) in symbiotic coral samples.
Figure 3
Figure 3
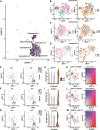
scRNA-seq identifies 28 transcriptomically distinct cell clusters across seven cell types in symbiotic and aposymbiotic O. arbuscula. (A) A UMAP projection of the transcriptomes of 6,458 cells from symbiotic (sym) and aposymbiotic (apo) O. arbuscula identifies 28 clusters across seven broad cell types. Each cluster is color coded. (B) Each cluster is transcriptomically distinct, with expression similarities present between clusters of the same cell type, as grouped by the 10 genes most highly expressed in each cluster. Expression values are the average log2fold changes computed from normalized gene expression data for each cell. Cell clusters are colored as in (A).
Figure 4
Figure 4
Gastrodermis cells along the algal-hosting trajectory are involved in lipid metabolism and nitrogen cycling. (A) UMAP projection of Gastrodermis 1, 2, 3, 4, and 5 as well as algal-hosting cells from symbiotic O. arbuscula overlaid with a graph of cell trajectories. Outcomes (fates) are denoted by grey circles with black numbers. Branch nodes are denoted by black circles with white numbers. (B) UMAP projections of the 1,019 independently reclustered Gastrodermis 1 cells revealed three subclusters. Each subcluster is color-coded in the left panel. Gastrodermis 1 cells separate according to symbiotic state across the UMAP projection (right panel). (C) UMAP projections of the 837 independently reclustered Gastrodermis 2 cells revealed three subclusters, color coded in the left panel. Gastrodermis 2 cells separate according to symbiotic state (right panel). (D) UMAP projections of the 547 independently reclustered Gastrodermis 3 cells revealed two subclusters, color coded in the left panel. Limited separation of Gastrodermis 3 cells by symbiotic state (right panel) was observed. Spatial representation of the gene expression of a putative Glutamate Dehydrogenase (g20747, E), Long-Chain Fatty Acid CoA Ligase (ACSBG1, F), and Acyl-Coenzyme A Thioesterase (ACOT4.2, G) across all cell clusters in both symbiotic states. Coloration represents per-cell-normalized expression of each gene. Expression of g20747 (H), ACSBG1 (I), and ACOT4.2 (J) were compared across subclusters and symbiotic states of Gastrodermis 1. Expression levels of genes in (H–J) are normalized per cell. Co-expression plots of g20747 and ACSBG1 (K), g20747 and ACOT4.2 (L), and ACSBG1 and ACOT4.2 (M) across Gastrodermis 1 cells from symbiotic O. arbuscula revealed significant co-expression of these nitrogen cycling and lipid metabolism genes within Subcluster 3, but not in the other subclusters. The coloration of each cell represents the per-cell mean expression value of each gene scaled to a maximum value of 10.
Figure 5
Figure 5
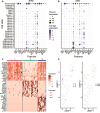
Negligible gene expression differences between cells in the immune cell cluster of symbiotic and aposymbiotic samples. Immune cells from symbiotic (A) and aposymbiotic (B) samples have high expression of previously identified immune cell marker genes. Dot size represents the percentage of cells in each cell state that express each gene, and dot color represents the average (normalized) expression of each gene within each cell state. (C) Three immune cell subclusters have distinct transcriptomic profiles, as represented by the annotated genes within the top 20 most highly enriched genes in each subcluster. Expression values are average log2fold changes computed from normalized gene expression data of each cell. Genes with no annotated Pfam domains were removed. (D) UMAP projections of the 107 independently reclustered immune cells revealed three subclusters (left panel) that do not separate according to symbiotic state (right panel).
Figure 6
Figure 6
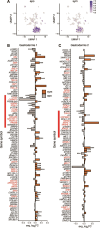
Gastrodermis 1 and 2 cells from symbiotic samples have downregulated immune pathway genes as compared to aposymbiotic samples. (A) Spatial representation showing expression of genes annotated with differentially enriched immunity GO terms across the whole dataset. Coloration represents the percentage of all transcripts in each cell corresponding to the genes of interest (255 genes of interest out of 20,719 total O. arbuscula genes with non-zero reads counts). (B) Seven PCs, driven by 89 genes (with annotated Pfam domains), contributed to the separation of symbiotic state in the reclustered UMAP of Gastrodermis 1 (see Fig. 4B). 29 of the 89 were differentially expressed. 27 genes are annotated with GO terms relating to immunity (red text). (C) Eight PCs, driven by 90 annotated genes, contributed to the separation of symbiotic state in the reclustered UMAP of Gastrodermis 2 (see Fig. 4C). 12 of the 90 genes were differentially expressed. 25 genes are annotated with GO terms relating to immunity (red text). In both (B) and (C), the red bar indicates genes annotated with the COG term “posttranslational modification, protein turnover, and chaperones.” significance is calculated from DESeq2 (*** = adjusted P < 0.001, ** = adjusted P < 0.01, * = adjusted P < 0.05).

Similar articles

References

    1. Thrall PH, Hochberg ME, Burdon JJ. et al. Coevolution of symbiotic mutualists and parasites in a community context. Trends Ecol Evol 2007;22:120–6. 10.1016/j.tree.2006.11.007 - DOI - PubMed
    1. Baker DM, Freeman CJ, Wong JCY. et al. Climate change promotes parasitism in a coral symbiosis. ISME J 2018;12:921–30. 10.1038/s41396-018-0046-8 - DOI - PMC - PubMed
    1. Lesser MP, Stat M, Gates RD. The endosymbiotic dinoflagellates (Symbiodinium sp.) of corals are parasites and mutualists. Coral Reefs 2013;32:603–11. 10.1007/s00338-013-1051-z - DOI
    1. Mansfield KM, Gilmore TD. Innate immunity and cnidarian-Symbiodiniaceae mutualism. Dev Comp Immunol 2019;90:199–209. 10.1016/j.dci.2018.09.020 - DOI - PubMed
    1. Zambrano-Villa S, Rosales-Borjas D, Carrero JC. et al. How protozoan parasites evade the immune response. Trends Parasitol 2002;18:272–8. 10.1016/S1471-4922(02)02289-4 - DOI - PubMed

Substances

LinkOut - more resources